
With shares of GSK plc (GSK.L) trading around 1,464.5p as of 8 September 2025, the stock has spent six months oscillating between 1,294p and 1,534p. The company pairs defensive characteristics (beta 0.29) with a sizable income profile (forward dividend yield 4.34% on a 0.64 per‑share rate, ex‑div 14 August 2025). Fundamentals are mixed: trailing‑twelve‑month revenue stands at 31.63B with quarterly revenue growth of 1.30% year over year, yet quarterly earnings growth is a stronger 23.0%, supported by a 30.52% operating margin and 10.82% profit margin. Cash generation remains solid (operating cash flow 7.72B; levered free cash flow 5.48B), but balance‑sheet metrics warrant monitoring, with total debt of 17.35B, debt‑to‑equity of 120.90% and a current ratio of 0.87. This three‑year outlook assesses risks, catalysts and plausible paths for the share price.
Key Points as of September 2025
- Revenue: TTM revenue 31.63B; quarterly revenue growth up 1.30% year over year.
- Profit/Margins: Operating margin 30.52%; profit margin 10.82%; EBITDA 9.29B; net income 3.42B; diluted EPS 0.83.
- Sales/Backlog: No backlog disclosed in this dataset; cash generation solid with operating cash flow 7.72B and levered free cash flow 5.48B.
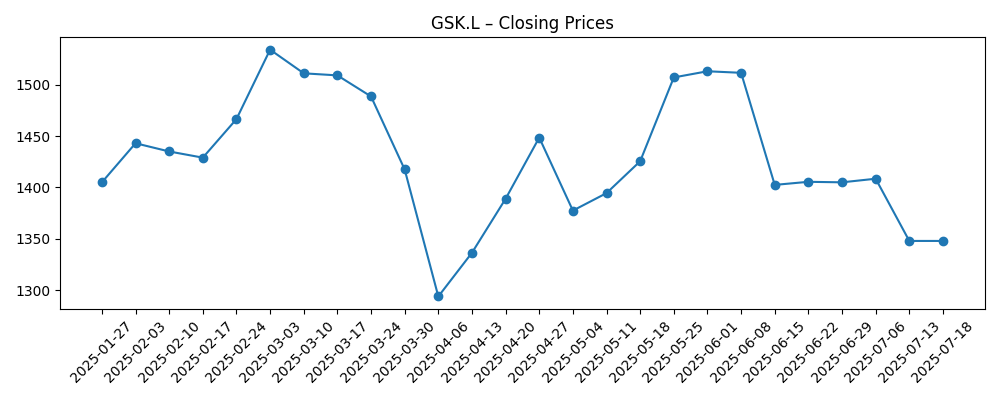
- Share price: Last close 1,464.5p (Sep 8); 6‑month range 1,294–1,534p; 50‑DMA 1,421.04; 200‑DMA 1,415.08; beta 0.29.
- Performance: 52‑week change −11.27% versus S&P 500 +18.47% in the same period.
- Dividend: Forward yield 4.34% on a 0.64 annual rate; payout ratio 74.97%; last ex‑dividend date 14 Aug 2025.
- Balance sheet: Total debt 17.35B; total debt/equity 120.90%; current ratio 0.87; total cash (mrq) 3.62B.
- Ownership: Approx. 45.90% held by institutions and 1.76% by insiders; float 3.91B shares.
- Market cap: Approx. £59B, derived from ~4.03B shares outstanding and a ~1,465p share price.
Share price evolution – last 12 months
Notable headlines
Opinion
Over the past six months, GSK’s shares have moved within a relatively tight 1,294–1,534p corridor, clustering near their 50‑ and 200‑day moving averages (1,421p and 1,415p, respectively). That technical posture suggests investors are weighing steady operating execution against modest top‑line momentum. Trailing revenue is 31.63B with quarterly revenue growth of 1.30% year over year, while earnings growth of 23.0% and a 30.52% operating margin signal improving mix and discipline. The 52‑week change of −11.27% contrasts with a strong S&P 500, highlighting sentiment gaps rather than an operational breakage. With a low beta of 0.29, the shares tend to be less sensitive to market swings, which can cap upside in euphoric tapes yet cushion downside. In our view, the next leg in the stock will hinge on whether margin strength persists while revenue growth nudges higher from today’s low base.
Income remains a central pillar of the equity story. The forward dividend yield sits at 4.34% on a 0.64 per‑share rate, and the payout ratio of 74.97% is elevated but not unmanageable given cash generation (operating cash flow 7.72B; levered free cash flow 5.48B). This combination positions the dividend as both a support for total returns and a constraint on capital flexibility. If earnings growth outpaces revenue, dividend cover should improve, reducing pressure on the balance sheet and allowing selective reinvestment. Conversely, if revenue growth stalls near current levels while costs creep, management could face a tougher capital‑allocation trade‑off. The ex‑dividend cadence (last ex‑date 14 August 2025) can create short‑term trading noise, but over a three‑year horizon the sustainability of cash returns—rather than timing—will matter most.
Balance‑sheet optics warrant attention. Total debt of 17.35B and a debt‑to‑equity ratio of 120.90% leave limited margin for policy error, and a current ratio of 0.87 underscores working‑capital discipline as a recurring priority. None of these metrics are alarming in isolation—especially with a large, diversified revenue base—but they do raise the bar for consistent execution. If management continues to convert profits into cash (OCF 7.72B; FCF 5.48B) while maintaining a 30.52% operating margin, gradual deleveraging is feasible without sacrificing the dividend. Should conditions tighten, refinancing terms and discretionary spending will be the levers to watch. In that scenario, the stock’s defensive beta could preserve capital relative to cyclical peers, but absolute returns would depend on the velocity of debt reduction and the stability of margins.
From a market‑structure angle, ownership by institutions (45.90%) and a sizable float (3.91B) suggest broad liquidity, aligning with the low‑beta profile. Over three years, we think performance bifurcates: an income‑led path where the dividend and steady cash flow drive mid‑single‑digit total returns, or an execution‑led path where a modest reacceleration of sales combines with resilient margins to re‑rate the multiple. Without projecting precise valuations, the ingredients for the latter are present in the data—positive earnings momentum and strong operating margins—but must be validated by sustained top‑line improvement. Should macro volatility reappear, the shares’ defensiveness could regain a premium. Net‑net, the setup appears balanced: downside cushioned by yield and cash generation, upside capped until revenue momentum broadens. Monitoring quarterly revenue growth against cost discipline will be the best early signal of which trajectory is taking hold.
What could happen in three years? (horizon September 2025+3)
| Scenario | Description |
|---|---|
| Best case | Revenue growth improves from the current low base while operating margin remains near recent levels. Cash conversion stays strong, enabling gradual deleveraging alongside steady or rising dividends. The equity narrative shifts from income‑only to balanced growth and income, supporting a higher trading range. |
| Base case | Top‑line growth remains modest, but cost control and portfolio mix sustain solid margins. Cash flows comfortably fund the dividend with incremental balance‑sheet improvement. Shares track fundamentals, with total return driven primarily by income and selective buy‑and‑build execution. |
| Worse case | Revenue growth stalls and margins compress, pressuring cash generation. Elevated leverage and a sub‑1 current ratio raise refinancing and allocation trade‑offs, increasing the risk of dividend recalibration. The share price gravitates toward the lower end of recent trading ranges until visibility improves. |
Projected scenarios are based on current trends and may vary based on market conditions.
Factors most likely to influence the share price
- Trajectory of quarterly revenue growth versus cost discipline and the 30.52% operating margin.
- Cash‑flow durability (OCF 7.72B; FCF 5.48B) and dividend sustainability given a 74.97% payout ratio.
- Balance‑sheet management, including deleveraging progress with total debt at 17.35B and D/E of 120.90%.
- Share‑price momentum relative to moving averages (50‑DMA 1,421.04; 200‑DMA 1,415.08) and beta of 0.29.
- Market sentiment and macro conditions that affect defensives versus cyclicals, influencing the yield premium.
- Regulatory or strategic developments that could alter revenue mix, margin profile, or capital allocation.
Conclusion
GSK enters the next three years with contrasting signals: modest top‑line growth (1.30% yoy in the latest quarter) against robust margin delivery (30.52% operating margin) and healthy cash generation. The dividend is central to the equity story at a 4.34% forward yield, but the 74.97% payout ratio and above‑average leverage mean capital allocation must remain disciplined. Recent trading—largely within 1,294–1,534p and near long‑term moving averages—implies investors are awaiting clearer evidence of sustained revenue momentum. If earnings strength continues and cash flow supports gradual deleveraging, the setup favors an income‑anchored total‑return path with optionality for re‑rating. Should margins slip or cash conversion weaken, the balance sheet could constrain flexibility and keep the shares range‑bound. On balance, we see a measured outlook: defensiveness and yield provide support, while improving growth execution would be the catalyst for better performance.
This article is not investment advice. Investing in stocks carries risks and you should conduct your own research before making any financial decisions.