
Novo Nordisk B A/S enters September 2025 after a turbulent year for the share price, with the stock down 60.54% over 52 weeks and recently closing around 350. Despite the sell-off, operating performance remains solid: trailing 12‑month revenue of 311.94B, profit margin of 35.61%, operating margin of 43.52%, and quarterly earnings growth of 32.20% year over year. Cash generation is strong at 121.53B operating cash flow, though liquidity is tight with a 0.78 current ratio and 99.27B of total debt versus 18.93B in cash. The company continues to return cash with a forward dividend yield of 3.33% and a payout ratio of 45.69%. With a 5‑year beta of 0.32, fundamentals and defensive characteristics could appeal to long‑term investors as the market reassesses growth, capacity expansion, and pricing dynamics in diabetes and obesity care.
Key Points as of September 2025
- Revenue – TTM revenue is 311.94B, with quarterly revenue growth (yoy) of 12.90%.
- Profit/Margins – Profit margin 35.61%; operating margin 43.52%; ROE 79.17%; ROA 21.82%.
- Sales/Backlog – Demand for GLP‑1 diabetes/obesity therapies remains central; scaling capacity and supply continuity are core focus areas.
- Share price – Recently around 350.0 (2025‑09‑05); 52‑week range 287.60–934.20; 52‑week change -60.54%; 50‑day MA 380.42; 200‑day MA 508.60; beta 0.32.
- Analyst view – Market tone is cautious after volatility; investors seek clearer visibility on supply expansion, pricing, and regulation.
- Market cap – Large‑cap global healthcare name; shares outstanding 3.37B; float 3.19B; institutions hold 36.19%; insiders 5.28%.
- Balance sheet – Total debt 99.27B vs total cash 18.93B; current ratio 0.78; debt/equity 59.06%.
- Cash returns – Operating cash flow 121.53B; levered FCF 26.44B; forward dividend yield 3.33% (payout 45.69%); ex‑dividend 2025‑08‑15.
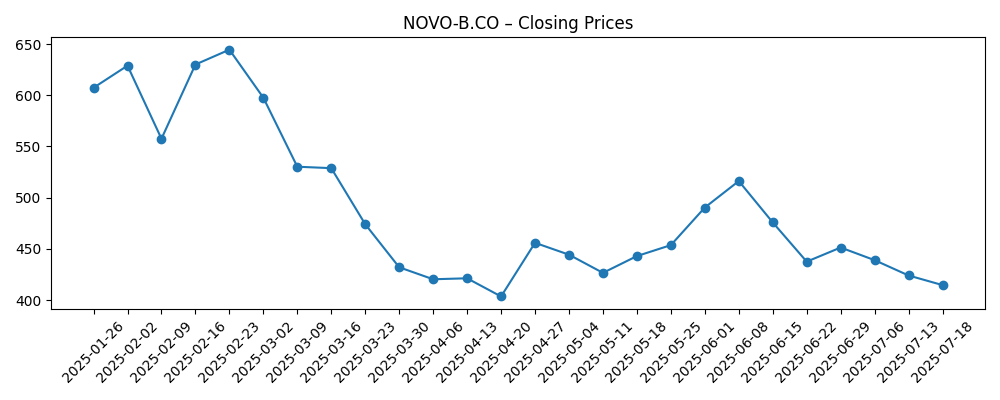
Share price evolution – last 12 months
Notable headlines
Opinion
The stock’s multi‑quarter slide appears to reflect a valuation reset and a shift from momentum to proof‑of‑execution. From 850.0 in mid‑September 2024 to a trough of 308.80 in late July 2025, investors repriced growth durability, supply cadence, and reimbursement risk. Yet operating metrics stayed robust: revenue at 311.94B, profit margin at 35.61%, and quarterly earnings growth of 32.20% signal underlying demand and scale. With beta at 0.32, the shares could serve as a lower‑volatility healthcare anchor if execution stabilizes. The 3.33% forward dividend introduces a carry component that was less material historically. Near term, the key question is whether capacity additions and channel inventory normalize enough to re‑accelerate revenue growth above the 12.90% recent pace without eroding margins.
Medium term, investors will watch how product mix evolves between diabetes and obesity care, where GLP‑1 demand has been strong industry‑wide. Margin sustainability is a focal point: the 43.52% operating margin provides cushion, but it also attracts competition and payer scrutiny. If pricing pressure intensifies, the company may need to lean more on volume growth and efficiency to keep earnings compounding. Conversely, stable reimbursement paired with supply expansion could extend the high‑margin window. Cash generation (121.53B operating cash flow) offers flexibility to invest in manufacturing, lifecycle management, and selective business development while maintaining the dividend policy (payout 45.69%). The balance sheet’s 99.27B of total debt and 0.78 current ratio argue for disciplined capital allocation.
The share‑price stabilization around the 50‑day moving average of 380.42 versus the 200‑day at 508.60 is a technical signpost for sentiment. A decisive move back toward the long‑term trend typically coincides with clearer supply visibility and steadier channel data, while failure to hold recent levels could imply lingering uncertainty. Ownership is diversified (36.19% institutions; 5.28% insiders), which can temper volatility but may also limit rapid rerating without new catalysts. In this context, guidance updates, manufacturing milestones, and regulatory signals are likely to dominate the tape. Absent fresh surprises, the stock may base as investors recalibrate expectations after the sharp 52‑week drawdown.
Looking out three years, the spread of outcomes is wide but navigable. In a constructive path, demand stays elevated, capacity ramps efficiently, and operating discipline preserves a high‑30s profit margin profile, supporting compounding cash flows and steady dividends. A more mixed path sees episodic supply bottlenecks and intermittent pricing pressure, keeping revenue growth around the recent 12.90% trend while margins oscillate. The adverse case would feature sustained reimbursement pushback and faster competitive encroachment, compressing growth and returns despite ongoing investment. Given a 0.32 beta and strong cash generation, the downside may be buffered, but not eliminated. Execution on scale‑up and policy engagement will likely determine which branch the company takes.
What could happen in three years? (horizon September 2025+3)
| Case | What it looks like | Potential share‑price setup | Key watchpoints |
|---|---|---|---|
| Best | Supply expansion meets demand; pricing stable; margins stay robust with disciplined costs and strong pipeline execution. | Sentiment improves; shares trend back toward long‑term averages and establish higher highs as confidence rebuilds. | Manufacturing milestones, capacity ramps, payer stability, and consistent quarterly growth delivery. |
| Base | Growth normalizes near recent trends; periodic supply tightness and selective pricing pressure; margins resilient but range‑bound. | Stock forms a multi‑quarter base, trading around moving averages with catalyst‑driven swings. | Inventory normalization, reimbursement updates, and product mix across diabetes vs. obesity indications. |
| Worse | Reimbursement headwinds and stronger competition; persistent supply constraints; margin compression despite investment. | Prolonged range‑bound or downward bias until visibility improves and execution resets. | Payer decisions, safety/label changes, and pace of competitor launches. |
Projected scenarios are based on current trends and may vary based on market conditions.
Factors most likely to influence the share price
- Manufacturing and supply scale‑up timelines for GLP‑1 therapies and the ability to meet demand consistently.
- Pricing and reimbursement decisions across major markets, including formulary access and utilization management.
- Clinical outcomes, safety signals, and label updates that could expand or limit eligible patient populations.
- Competitive launches and lifecycle management by peers affecting market share and pricing dynamics.
- Regulatory, litigation, and policy shifts impacting drug pricing, rebates, or distribution.
Conclusion
Novo Nordisk’s three‑year outlook hinges on execution: scaling supply to meet durable GLP‑1 demand while preserving attractive margins and navigating payer scrutiny. Despite a sharp 52‑week drawdown and a recent close near 350, the operating picture remains strong with 311.94B in TTM revenue, 35.61% profit margin, 43.52% operating margin, and 32.20% quarterly earnings growth (yoy). Cash generation of 121.53B provides room to invest in capacity, sustain dividends (forward 3.33% yield), and keep balance‑sheet flexibility even with 99.27B of total debt and a 0.78 current ratio. From here, clearer visibility on manufacturing milestones, reimbursement stability, and product‑mix evolution could enable a rerating toward longer‑term averages, while setbacks on any front may extend the base‑building phase. With a 0.32 beta, the shares offer defensive qualities, but outcomes will likely track the cadence of execution and policy developments rather than market beta.
This article is not investment advice. Investing in stocks carries risks and you should conduct your own research before making any financial decisions.