
Fagron N.V. (FAGR.BR) enters September 2025 with improving momentum and low volatility. The share has risen 9.75% over 12 months and recently closed near 21.05. Fundamentals look resilient: revenue of 918.75 million (ttm), profit and operating margins at 9.33% and 15.38%, and EBITDA of 158.25 million. Cash generation is healthy (operating cash flow 120.42 million; levered free cash flow 57.06 million), backed by a 1.76 current ratio and debt of 404.44 million. Valuation remains reasonable at 17.99x trailing earnings and 15.04x forward, with a 1.66% forward dividend yield and a 29.91% payout ratio. This three‑year outlook focuses on execution, margin discipline, and capital allocation, with low beta (0.24) and solid returns on equity providing a defensive profile.
Key Points as of September 2025
- Revenue: TTM revenue 918.75M; quarterly revenue growth (yoy) 10.90% indicates healthy momentum.
- Profit/Margins: Profit margin 9.33% and operating margin 15.38%; EBITDA 158.25M; diluted EPS 1.17 (ttm).
- Sales/Cash Flow: Revenue per share 12.60; operating cash flow 120.42M; levered free cash flow 57.06M.
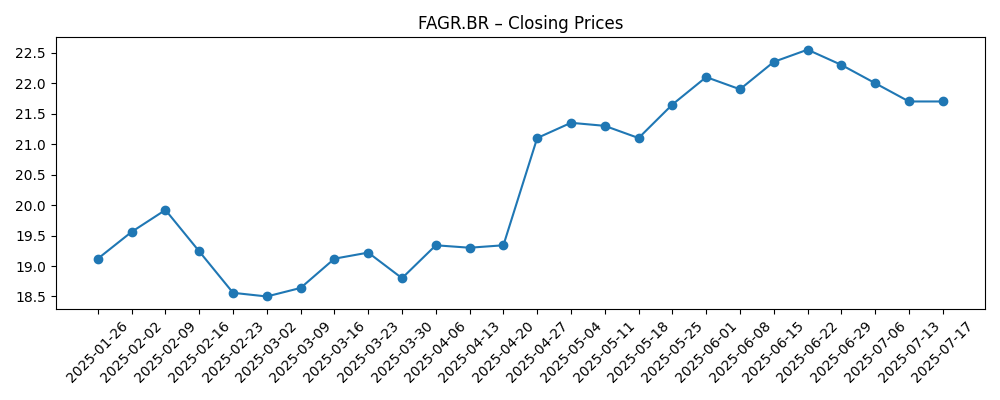
- Share price: 6‑month trend improved from high‑18s to 21.05 (Sep 5, 2025); 52‑week range 15.14–23.50; beta 0.24.
- Moving averages: 50‑day 21.45 and 200‑day 19.93 suggest an intermediate uptrend.
- Valuation: Trailing P/E 17.99 and forward P/E 15.04; EV/EBITDA 10.86.
- Market cap/EV: Market cap 1.54B; enterprise value 1.85B.
- Balance sheet: Total debt 404.44M; debt/equity 80.02%; current ratio 1.76; cash 89.27M.
- Ownership/Income: Institutions hold 66.03% and insiders 5.13%; forward dividend yield 1.66% with a 29.91% payout ratio.
Share price evolution – last 12 months
Notable headlines
Opinion
Fagron’s setup into the next three years is defined by improving growth, contained volatility, and a valuation that already discounts some execution but not a full re‑rating. The 10.90% quarterly revenue growth (yoy) and 12.70% earnings growth show demand resilience and operational control. With a forward P/E at 15.04 versus 17.99 trailing, the market expects earnings to advance, potentially allowing multiple stability even if broader markets wobble. The 1.66% dividend, underpinned by a sub‑30% payout ratio, adds a modest carry that can compound returns when paired with continued cash generation. The primary debate is whether margin discipline can be sustained while investing for growth.
Cash flow and balance‑sheet metrics support a patient compounding case. Operating cash flow of 120.42M and levered free cash flow of 57.06M provide flexibility to fund organic initiatives, incremental capacity, and shareholder returns, while keeping leverage in check. With EV/EBITDA at 10.86 and debt/equity at 80.02%, deleveraging would be a credible, value‑accretive use of cash that can lower enterprise risk and support valuation. If revenues continue to expand at a healthy clip, a mix of reinvestment and gradual debt reduction could leave equity holders with a cleaner capital structure by the end of the horizon.
Share performance has been constructive: after dipping in late 2024, the stock recovered through mid‑2025, trading near the 50‑day moving average of 21.45 and above the 200‑day of 19.93. The 52‑week range of 15.14–23.50 frames sentiment between defensiveness and optimism. Low beta (0.24) can be a feature, not a bug, for investors seeking healthcare exposure with muted market sensitivity. The path to breaking out of the upper end of the range likely runs through consistent double‑digit growth prints and steady profitability, reassuring investors that recent improvements are durable rather than cyclical.
Key risks remain. Healthcare regulation and reimbursement dynamics can affect pricing and demand across specialty pharmaceutical supply chains. Input cost inflation or supply disruptions could pressure gross profit (420.32M ttm) and working capital. Competition may weigh on pricing or share in certain niches, raising the bar for differentiation and service quality. That said, with returns on equity at 17.53% and a conservative payout policy, Fagron appears positioned to navigate cyclical bumps while compounding value if execution continues.
What could happen in three years? (horizon September 2025+3)
| Scenario | Narrative |
|---|---|
| Best | Consistent revenue growth and disciplined cost control sustain margins, cash flow strengthens, leverage trends down, and the market rewards execution with a durable re‑rating above the recent range. Dividend capacity improves while reinvestment remains funded. |
| Base | Steady growth with stable margins; cash generation funds maintenance capex, selective growth projects, and a growing dividend. Valuation multiples remain broadly in line with current levels, producing mid‑single‑digit to high‑single‑digit annualized returns. |
| Worse | Regulatory or competitive pressure slows growth and compresses margins; working‑capital needs rise, limiting deleveraging. Multiples drift lower toward a more defensive posture, and the share trades toward the lower end of its historical range. |
Projected scenarios are based on current trends and may vary based on market conditions.
Factors most likely to influence the share price
- Execution on revenue growth and margin discipline versus guidance and historic run‑rates.
- Regulatory/reimbursement developments affecting pricing, demand, or compliance costs.
- Input costs and supply chain reliability impacting gross profit and cash conversion.
- Capital allocation: pace of deleveraging, dividend policy, and any selective M&A.
- Market sentiment toward defensive, low‑beta healthcare names and small/mid‑cap liquidity.
Conclusion
Fagron’s investment case over the next three years rests on a straightforward playbook: maintain healthy growth, protect margins, and compound cash while steadily improving the balance sheet. Recent data points—double‑digit revenue and earnings growth, solid operating cash flow, and a reasonable forward multiple—suggest the company is on track. With low beta and a sustainable dividend policy, the downside profile appears cushioned by cash generation and defensive characteristics. Upside depends on continued execution that can either sustain the current valuation or invite a measured re‑rating if growth and returns prove durable. Against this backdrop, the base case implies steady value compounding, the bull case points to deleveraging‑led multiple resilience and incremental yield, and the bear case hinges on regulatory or competitive pressure. For investors seeking quality‑tilted exposure in healthcare services, Fagron merits close monitoring.
This article is not investment advice. Investing in stocks carries risks and you should conduct your own research before making any financial decisions.