As of September 2025, Roche’s investment case blends defensive cash generation with pipeline execution risk. The group reports trailing‑twelve‑month revenue of 63.49B and maintains robust profitability (operating margin 36.14%, profit margin 14.85%). Cash generation is solid (operating cash flow 19.28B; levered free cash flow 11.73B) alongside a 3.54% forward dividend yield, albeit with a relatively high payout ratio of 82.62%. Shares recently traded near 270.10, within a 52‑week range of 231.90–313.80, and sit close to the 200‑day moving average of 268.59 with a low beta of 0.18. Valuation signals a value tilt: forward P/E of 12.95 versus a trailing P/E of 23.36 and a PEG of 0.68. With quarterly revenue growth of 3.60% year over year and quarterly earnings growth of 18.40%, investors will focus on execution, capital allocation, pricing dynamics, and regulatory outcomes over the next three years.
Key Points as of September 2025
- Revenue: 63.49B (ttm); quarterly revenue growth (yoy) at 3.60% indicates steady demand across businesses.
- Profit/Margins: Operating margin 36.14%; profit margin 14.85%; ROE 31.32% and ROA 13.30% underscore capital efficiency.
- Cash & Balance Sheet: Operating cash flow 19.28B; levered free cash flow 11.73B; total debt 34.63B; current ratio 1.29; debt/equity 104.81%.
- Sales/Backlog: Revenue per share 79.71; quarterly earnings growth (yoy) 18.40%; no backlog disclosed here.
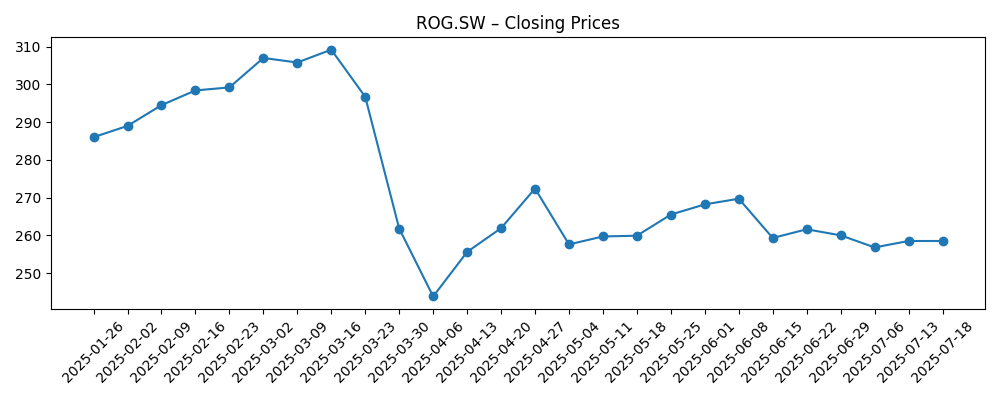
- Share price: Last close ~270.10 (2025‑09‑08); 52‑week range 231.90–313.80; 50‑DMA 258.30, 200‑DMA 268.59; beta 0.18.
- Analyst view proxy (valuation): Trailing P/E 23.36 vs forward P/E 12.95; PEG 0.68; EV/EBITDA 13.38; EV/Revenue 3.80; Price/Sales 3.47.
- Market cap: 219.95B; Enterprise value 240.96B; shares outstanding 689.63M; float 731M; institutions hold ~39.99%.
- Dividend: Forward annual dividend rate 9.7; yield 3.54%; payout ratio 82.62%; last dividend date 3/31/2025 (ex‑date 3/27/2025).
Share price evolution – last 12 months
Notable headlines
Opinion
Roche’s valuation framework suggests the market is leaning toward an earnings recovery while still pricing in pipeline and pricing risks. The forward P/E of 12.95, well below the trailing multiple, and a PEG of 0.68 imply expectations of profit expansion relative to the current price. That setup is supported by healthy cash generation and a dividend yield of 3.54%, which help anchor total return potential. At the same time, a payout ratio of 82.62% limits flexibility if free cash flow growth were to slow. The balance sheet is serviceable but geared (debt/equity 104.81%), which favors disciplined capital allocation. In our view, the equity story over the next three years will likely hinge on clinical readouts, regulatory outcomes, and diagnostics demand normalization, with cost control and mix improvement acting as potential offsets to pricing headwinds.
The share price has been choppy over the past six months: a rally into March was followed by a sharp April drawdown and subsequent consolidation. Today, shares near 270.10 sit close to the 200‑day moving average of 268.59, suggesting a neutral technical posture while volatility remains relatively low (beta 0.18). This technical backdrop aligns with “wait‑and‑see” fundamental positioning: investors appear to be watching for catalysts that could shift sentiment decisively. Should earnings momentum implied by the forward multiple materialize, the stock could re‑rate toward the higher end of its 52‑week range. Conversely, disappointing data, reimbursement headwinds, or operational hiccups could see the shares test prior support.
From a fundamental viewpoint, Roche’s diversified model—pharmaceuticals and diagnostics—adds resilience. The company’s operating margin of 36.14% and profit margin of 14.85% indicate substantial operating leverage if top‑line growth accelerates beyond the current 3.60% quarterly revenue growth (yoy). Strong operating cash flow of 19.28B and levered free cash flow of 11.73B provide capacity to invest, manage debt, and sustain dividends. However, high return metrics (ROE 31.32%) also raise the bar for incremental projects: new investments must compete with an already strong baseline. The next phase may emphasize focused R&D prioritization, targeted business development, and efficiency gains to preserve margins while navigating price pressure and generic/biosimilar competition.
Capital structure and policy are important swing factors. With total debt of 34.63B and a current ratio of 1.29, Roche appears comfortably liquid but not under‑levered. Maintaining balance sheet flexibility would help address potential volatility in regulatory timelines and launch curves. The dividend remains a central part of the equity story; sustaining a 3.54% yield with an 82.62% payout ratio will likely require continued cash discipline and earnings growth. In this context, valuation is a double‑edged sword: it cushions downside if fundamentals hold, but it may cap upside without clear catalysts. Over three years, we think successful late‑stage execution, stable diagnostics demand, and measured capital deployment are the most credible path to attractive risk‑adjusted returns.
What could happen in three years? (horizon September 2025+3)
| Scenario | Description | Potential share impact |
|---|---|---|
| Best | Multiple late‑stage programs and diagnostics initiatives meet or beat expectations; reimbursement remains constructive; cost discipline preserves margins and cash generation. | Re‑rating toward the upper end of historical ranges as confidence in sustained earnings growth builds; dividend considered secure. |
| Base | Steady execution with mixed clinical outcomes; modest top‑line expansion; margins broadly stable as mix and efficiencies offset pricing pressure. | Range‑bound trading around long‑term averages; total return led by dividend and incremental earnings progress. |
| Worse | Key studies disappoint or approvals delay; pricing tightens; diagnostics volumes soften; investment needs rise, pressuring free cash flow. | De‑rating toward prior support levels; focus shifts to balance sheet protection and dividend sustainability. |
Projected scenarios are based on current trends and may vary based on market conditions.
Factors most likely to influence the share price
- Clinical and regulatory outcomes for late‑stage assets and major label expansions.
- Pricing and reimbursement trends across key markets, including biosimilar/generic competition.
- Diagnostics demand normalization and instrument/utilization trends.
- Capital allocation: R&D prioritization, business development, and dividend policy within cash flow constraints.
- Macro factors: currency movements, inflation on inputs, and interest‑rate effects on valuation.
Conclusion
Roche enters the next three years with a defensible mix of cash flow, scale, and diversification, offset by familiar industry risks. Financially, margins and cash generation provide a cushion, while valuation suggests the market anticipates earnings improvement. The dividend is an important pillar of return, though the elevated payout ratio increases sensitivity to free cash flow variance. Technically, shares near long‑term averages reflect an equilibrium between risks and prospects; decisive clinical or regulatory news will likely break that balance. In our base case, measured execution, stable diagnostics, and disciplined capital deployment underpin steady value creation. Upside requires clear catalysts and delivery on growth initiatives; downside centers on development setbacks or pricing pressure. For investors comfortable with large‑cap healthcare dynamics, Roche offers a balanced, income‑supported exposure with moderate sensitivity to market swings.
This article is not investment advice. Investing in stocks carries risks and you should conduct your own research before making any financial decisions.