
Koninklijke BAM Groep (BAMNB.AS) enters the next three years with improving momentum but thin construction margins. Over the past 12 months the share price has risen 116.48% and sits near its 52‑week high (8.44), supported by better top‑line growth and earnings recovery. On trailing figures, BAM reports 6.69B revenue, 1.93% net margin and 236.94M EBITDA; return on equity is 11.88%. The balance sheet shows 500.6M cash against 347.4M debt and a current ratio of 0.97, underscoring the importance of disciplined working‑capital management. Valuation has reset: trailing P/E is 33.70 but the forward P/E of 10.76 and EV/EBITDA of 8.50 imply expectations for further profit normalization. Investors also receive a 3.23% forward dividend yield (payout ratio 86.96%). This note outlines scenarios, risks and catalysts for BAM’s equity through August 2028.
Key Points as of August 2025
- Revenue: TTM revenue 6.69B; quarterly revenue growth (yoy) 7.30%; revenue per share 25.53.
- Profit/Margins: Profit margin 1.93%; operating margin 2.87%; EBITDA 236.94M; ROE 11.88%; ROA 2.99%.
- Cash and leverage: Total cash 500.6M; total debt 347.4M; enterprise value 1.82B; total debt/equity 39.21%.
- Liquidity: Current ratio 0.97; operating cash flow 287.19M; levered free cash flow 138.54M.
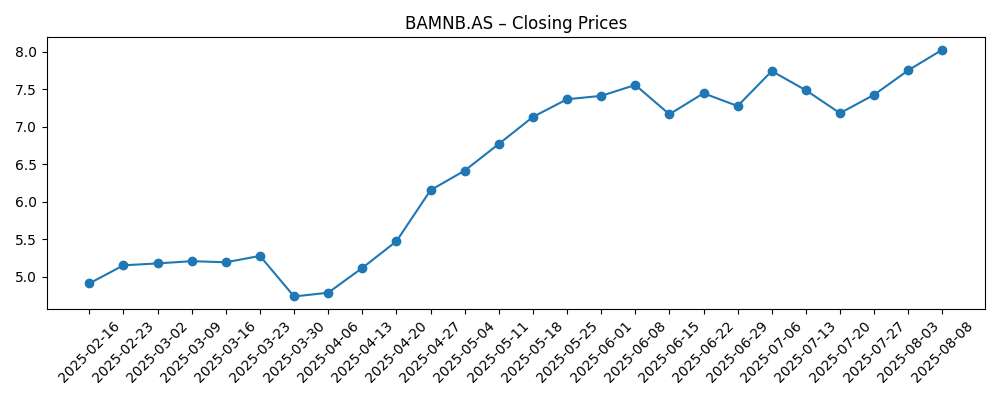
- Share price: Last weekly close 8.025 (2025-08-08); 52‑week high 8.44; low 3.51; 50‑day MA 7.47; 200‑day MA 5.52; beta 1.35; 52‑week change 116.48%.
- Valuation: Market cap 2.04B; Price/Sales 0.32; Price/Book 2.28; EV/Revenue 0.28; EV/EBITDA 8.50; trailing P/E 33.70; forward P/E 10.76.
- Dividend: Forward annual dividend rate 0.25; forward yield 3.23%; payout ratio 86.96%; ex‑dividend 5/12/2025.
- Sales/Backlog: Backlog not provided here; execution discipline and project selectivity remain focal points.
- Ownership & liquidity: Float 259.42M; institutions hold 39.77%; average volume (3m) 1.1M.
Share price evolution – last 6 months
Notable headlines
Opinion
The equity story into 2028 starts with price action and valuation. Shares have broken out above both the 50‑day (7.47) and 200‑day (5.52) moving averages, and the latest weekly close of 8.025 sits close to the 52‑week high of 8.44. That strength coincides with improving year‑over‑year revenue and earnings growth. Importantly, the multiple backdrop has shifted: a trailing P/E of 33.70 compresses to a forward P/E of 10.76, suggesting the market expects a material earnings step‑up. For a contractor with historically thin margins, that expectation is less about chasing volume and more about mix and risk management. Over the next three years, the share price trajectory is likely to be governed by how consistently BAM converts a healthy order pipeline into cash, while avoiding fixed‑price pitfalls that can erode profitability.
Operating quality is the crux. Trailing profitability remains modest (1.93% net margin; 2.87% operating margin), but cash generation is encouraging: 287.19M operating cash flow and 138.54M levered free cash flow on 6.69B of revenue. Those figures indicate better project execution and working‑capital discipline, although the current ratio at 0.97 shows little room for error. If selectivity continues to improve and inflation pass‑throughs remain effective, margins can edge higher without stretching the balance sheet. Conversely, any cluster of loss‑making projects could undo gains quickly. Over a three‑year horizon, we think the path of least resistance is gradual margin accretion, supported by tighter bidding, a focus on lower‑risk segments, and ongoing cost control, rather than a pursuit of aggressive top‑line growth.
Capital allocation will color the investment case. Cash exceeds debt (500.6M vs 347.4M), which underpins resilience and optionality. Management has room to prioritize balance‑sheet strength, fund selective growth, and sustain dividends. The forward yield is 3.23% on a 0.25 dividend, but the trailing payout ratio of 86.96% looks high against thin margins, making dividend cover dependent on earnings progression implied by the forward P/E. Over the next three years, we expect a pragmatic approach: keep cash conversion front‑and‑center, maintain conservative leverage, and calibrate shareholder returns to project risk and working‑capital needs. Any step‑up in returns on equity from the current 11.88% would support a sturdier dividend policy and, potentially, share buybacks, provided execution risks remain contained.
Valuation leaves room for delivery to drive re‑rating. Price/Sales of 0.32 and EV/Revenue of 0.28 imply modest expectations, while EV/EBITDA of 8.50 sits in a range that can move meaningfully with incremental margin gains. Beta of 1.35 signals above‑market volatility, so setbacks could have outsized effects on the share price. Over three years, a credible track record of bid discipline, supply‑chain management, and predictable cash conversion would justify a tighter risk premium. In contrast, negative surprises on project outcomes or liquidity would likely pull the multiple back. Net‑net, the balance of probabilities favors a base case of steady, execution‑led compounding with upside from mix and risk reduction, and downside chiefly from operational missteps.
What could happen in three years? (horizon August 2025+3)
| Scenario | What it looks like by August 2028 | Equity implications |
|---|---|---|
| Best | Disciplined bidding and a higher share of lower‑risk work improve margins and stabilize cash conversion. Working‑capital turns are tighter, and the balance sheet remains strong. | Valuation re‑rates as earnings grow into the forward multiple; dividend is well covered and capital returns expand alongside selective growth investment. |
| Base | Execution is generally solid with occasional project noise. Margins trend modestly higher, cash generation remains adequate, and financial policy stays conservative. | Total returns track earnings growth and dividend; multiple is broadly stable, with periods of volatility around project milestones. |
| Worse | Cost inflation, supply‑chain frictions or fixed‑price slippage compress margins and tie up working capital. Liquidity tightens and priorities shift to balance‑sheet protection. | De‑rating as profitability disappoints; dividend policy becomes more cautious, and the focus turns to risk reduction rather than growth. |
Projected scenarios are based on current trends and may vary based on market conditions.
Factors most likely to influence the share price
- Project execution risk on complex or fixed‑price contracts, including cost overruns and delay penalties.
- Order intake quality and mix, affecting margin resilience and the predictability of cash conversion.
- Working‑capital dynamics and liquidity, given a current ratio of 0.97 and the sector’s seasonality.
- Input‑cost trends (labor, materials) and the effectiveness of contract indexing and pass‑through mechanisms.
- Capital allocation choices between dividends, balance‑sheet strength and selective growth investments.
- Macro and policy backdrop in core European construction and infrastructure end‑markets.
Conclusion
As of today, BAM combines strong share‑price momentum with tentative—but improving—fundamentals. The investment debate for the next three years centers on whether cash‑flow discipline and project selectivity can steadily lift margins while keeping risk contained. The balance sheet is a source of strength, with cash exceeding debt, and cash generation improving. Valuation embeds both opportunity and responsibility: EV/EBITDA of 8.50 and a forward P/E of 10.76 assume continued delivery, while the high trailing payout ratio underscores the need for earnings follow‑through to sustain dividends. Against that backdrop, we see a balanced outlook: upside from incremental operational gains and risk reduction; downside from execution setbacks and liquidity pressure. For long‑term investors, monitoring bid discipline, cash conversion, and capital allocation will be critical to assessing whether today’s re‑rating can evolve into durable value creation by August 2028.
This article is not investment advice. Investing in stocks carries risks and you should conduct your own research before making any financial decisions.