


BE Semiconductor Industries (BESI.AS) enters August 2025 with resilient profitability but cyclical revenue pressure. The stock closed the week at 120.85, up 6.91% over 52 weeks yet trailing the S&P 500’s 18.63%. Trailing‑12‑month revenue stands at 0.60 billion, with a 28.17% net margin and 29.37% operating margin; quarterly revenue declined 2.0% year over year and quarterly earnings fell 23.6%. Liquidity remains strong (current ratio 5.73) with 0.49 billion cash against 0.54 billion debt, and operating cash flow of 0.21 billion. The shares have swung between 79.62 and 152.75 over the past year and now trade near the 50‑day average of 121.57. A forward dividend of 2.18 (1.82% yield; 102.35% payout) offers income but raises sustainability questions if the cycle stays soft. This note outlines a three‑year outlook and key drivers for BESI.
Key Points as of August 2025
- Revenue: 0.60 billion (ttm); quarterly revenue growth (yoy) −2.0%.
- Profit/Margins: Net margin 28.17%; operating margin 29.37%; ROE 42.88% and ROA 12.77% underscore capital efficiency.
- Sales/Backlog: No backlog disclosed here; quarterly earnings growth −23.6% yoy signals near‑term softness typical of industry cycles.
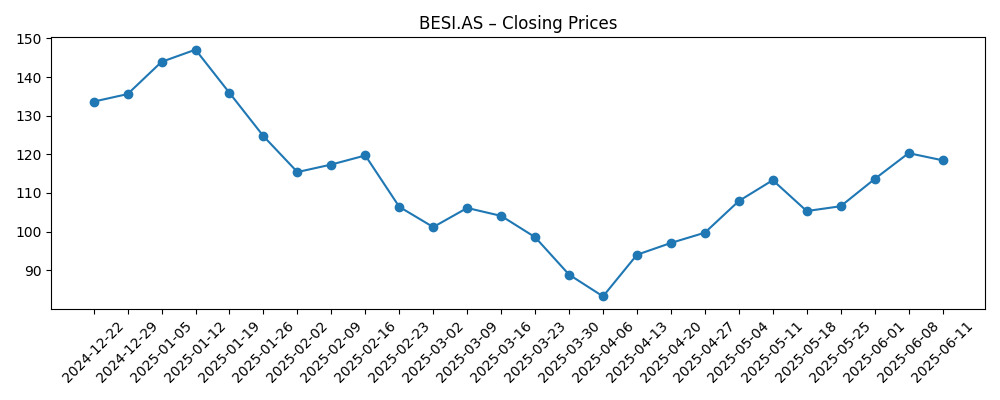
- Share price: 120.85 (Aug 8, 2025); 52‑week range 79.62–152.75; trading near 50‑day MA 121.57 and above 200‑day MA 115.70; beta 1.27.
- Analyst view: Recent comparative coverage highlights BESI’s profitability vs peers; no rating consensus is provided in the referenced materials.
- Market cap: Implied ~9.6 billion based on 79.06M shares outstanding and the 120.85 recent price.
- Balance sheet/liquidity: Cash 0.49 billion; debt 0.54 billion; debt/equity 151.5%; current ratio 5.73; operating cash flow 0.21 billion; levered FCF 0.11 billion.
- Dividend: Forward rate 2.18 (yield 1.82%); payout ratio 102.35%; last ex‑div date 4/25/2025.
- Ownership & trading: Float 70.33M; institutions hold 71.96%; insiders 10.84%; 3‑month avg volume 454.55k (10‑day 406.59k).
Share price evolution – last 12 months
Notable headlines
- BE Semiconductor Industries (OTCMKTS:BESIY) & Axcelis Technologies (NASDAQ:ACLS) Financial Review
- Comparing BE Semiconductor Industries (OTCMKTS:BESIY) and Axcelis Technologies (NASDAQ:ACLS)
- BE Semiconductor Industries (OTCMKTS:BESIY) versus Axcelis Technologies (NASDAQ:ACLS) Critical Analysis
- BE Semiconductor Industries (OTCMKTS:BESIY) vs. Axcelis Technologies (NASDAQ:ACLS) Head‑To‑Head Analysis
Opinion
BESI’s three‑year setup hinges on the interplay between secular demand for advanced packaging and the inherently cyclical nature of capital equipment ordering. The data show strong unit economics today—net margin of 28.17% and operating margin of 29.37%—even as quarterly revenue contracts modestly (−2.0% yoy) and earnings compress (−23.6% yoy). The stock’s path over the last year—from a 152.75 peak to a 79.62 trough and back near the 50‑day average—suggests investors are already discounting mid‑cycle volatility. Trading above the 200‑day moving average indicates improving sentiment, but follow‑through likely requires clearer order momentum. If AI‑driven chip architectures continue to demand denser interconnects and more sophisticated assembly steps, BESI’s profitability profile suggests it is positioned to monetize that mix shift as orders re‑accelerate into the next upturn.
Capital returns are a central investor debate. The forward dividend yields 1.82% on a payout ratio of 102.35%, a figure that reflects cycle‑trough earnings rather than structural overdistribution. With 0.49 billion of cash, 0.54 billion of debt, a robust current ratio (5.73), and 0.21 billion in operating cash flow, BESI has room to navigate a soft patch while continuing shareholder distributions. Over the next three years, sustainability likely depends on the cadence of order intake and gross margin stability. If revenue normalizes upward, coverage improves organically; if softness persists, management could rebalance toward buybacks or a flexible dividend framework. Either way, the balance sheet affords options to prioritize R&D and capacity where returns are demonstrably above the cost of capital.
Comparative coverage versus Axcelis underscores what investors already notice: BESI’s profitability metrics compare well within the semi‑capital ecosystem, which should support relative valuation through the cycle. However, the absence of backlog data here and the industry’s reliance on a handful of large customers amplify forecasting error. Over the horizon, watch for disclosures on order mix, regional exposure, and customer concentration, alongside any regulatory developments that could affect export eligibility. Execution on product roadmaps in advanced assembly will matter more than broad macro headlines; firms that enable smaller form factors, improved yields, and better power performance tend to gain share when nodes transition. If BESI continues to translate its engineering leverage into cash conversion—visible in positive levered FCF—equity holders could see multiple support alongside earnings recovery.
Technically, the shares consolidating around the 50‑day average (121.57) while holding above the 200‑day (115.70) suggests a constructive bias, but confirmation requires catalysts: order inflections, large customer wins, or visibility on 2026–2027 capex budgets. Given beta of 1.27 and average liquidity (≈455k shares/day over three months), moves can be swift around news. Over three years, a reasonable base case is that BESI tracks the next capex upcycle with margins staying in the high‑20s, supporting rising cash generation and a right‑sized dividend. Upside comes from faster AI packaging adoption and share gains; downside stems from prolonged digestion, pricing pressure, or policy shocks that delay spend. The wide 52‑week range reminds investors to size positions with volatility in mind.
What could happen in three years? (horizon August 2025+3)
| Scenario | Operational markers | Financial profile | Equity view |
|---|---|---|---|
| Best | AI/advanced‑packaging demand accelerates; sustained order growth; strong mix | Revenue CAGR high single‑digits to low teens; operating margin sustained in high‑20s; solid FCF | Re‑rates toward cycle highs as earnings expand; dividend comfortably covered and potentially grows |
| Base | Gradual capex normalization; steady bookings; disciplined costs | Revenue CAGR low–mid single digits; margins broadly stable around current levels; positive FCF | Tracks earnings growth; total return led by EPS recovery with a maintained, prudently calibrated dividend |
| Worse | Prolonged equipment digestion; competitive pricing; policy or export headwinds | Flat to declining revenue; margin compression; tighter cash generation | Trades toward lower end of historical range; dividend policy becomes more flexible to preserve balance sheet |
Projected scenarios are based on current trends and may vary based on market conditions.
Factors most likely to influence the share price
- Order trends for advanced packaging and assembly tools, including timing of the next WFE upcycle.
- Gross margin resilience versus competitive pricing and product mix shifts.
- Capital allocation decisions (dividend calibration, buybacks) amid a >100% payout on trough earnings.
- Customer concentration and qualification cycles for new platforms or nodes.
- Regulatory and trade policy developments affecting export eligibility and regional demand.
- FX and macro volatility impacting euro‑denominated results and investor risk appetite.
Conclusion
BESI’s investment case over the next three years balances durable profitability with cyclical revenue variability. The company enters this period with strong margins (net 28.17%; operating 29.37%) and ample liquidity (current ratio 5.73), which together provide flexibility to fund R&D and maintain shareholder returns through the cycle. While the 52‑week share‑price range of 79.62–152.75 highlights volatility, trading above the 200‑day moving average suggests improving sentiment as investors look through near‑term softness (−2.0% revenue yoy; −23.6% earnings yoy). A forward dividend of 2.18 at a 1.82% yield is attractive but will be judged against cash generation as demand normalizes. Key catalysts include clearer booking trends, evidence of mix‑driven margin durability, and updates on customer programs. If secular drivers in advanced packaging persist, BESI appears positioned to compound value; if the downcycle proves longer, defensiveness will hinge on cost control and disciplined capital allocation.
This article is not investment advice. Investing in stocks carries risks and you should conduct your own research before making any financial decisions.


