


BYD Company (1211.HK) enters August 2025 with strong top-line momentum and a mixed near-term setup. Trailing‑12‑month revenue is 822.52B with quarterly revenue growth of 36.30% year over year, while net margin stands at 5.45% and operating margin at 4.95%. Return on equity is 23.07%, supported by vertical integration in EVs, batteries and energy storage. Liquidity is ample with 153.39B in cash against 41.13B in total debt, yet the current ratio of 0.81 and levered free cash flow of -13.38B flag ongoing reinvestment demands. Shares are up 56.11% over 12 months; after a 6:1 stock split on July 30, 2025, the price has consolidated near 115.10, below the 50‑day average of 120.800 but close to the 200‑day at 115.243. A 20.60% payout ratio and 1.23% forward yield offer modest income while the growth story evolves.
Key Points as of August 2025
- Revenue: TTM revenue 822.52B; revenue per share 94.12; quarterly revenue growth (yoy) 36.30%.
- Profit/Margins: Gross profit 156.47B; EBITDA 116.55B; net income 44.81B; profit margin 5.45%; operating margin 4.95%; ROE 23.07%; ROA 4.03%.
- Sales/Backlog: Sales momentum evident in MRQ growth; backlog not disclosed. Operating cash flow 131.81B; levered free cash flow -13.38B reflects high reinvestment.
- Share price: Last close 115.10 (Aug 27, 2025); 52‑week high/low 158.867/72.333; 50‑DMA 120.800 vs 200‑DMA 115.243; 52‑week change +56.11%; beta 0.33; 6:1 split on 7/30/2025.
- Analyst view: Coverage focuses on execution and margin trajectory versus global peers; dividend policy steady with payout ratio 20.60% and forward yield 1.23% (ex‑div 6/10/2025).
- Market cap: Large‑cap EV/battery leader with 3.68B shares outstanding; institutions hold 42.40%, insiders 0.12%.
- Balance sheet/liquidity: Total cash 153.39B vs total debt 41.13B; current ratio 0.81; debt/equity 16.71%.
- Benchmarking: Outperformed S&P 500 52‑week change (56.11% vs 15.62%).
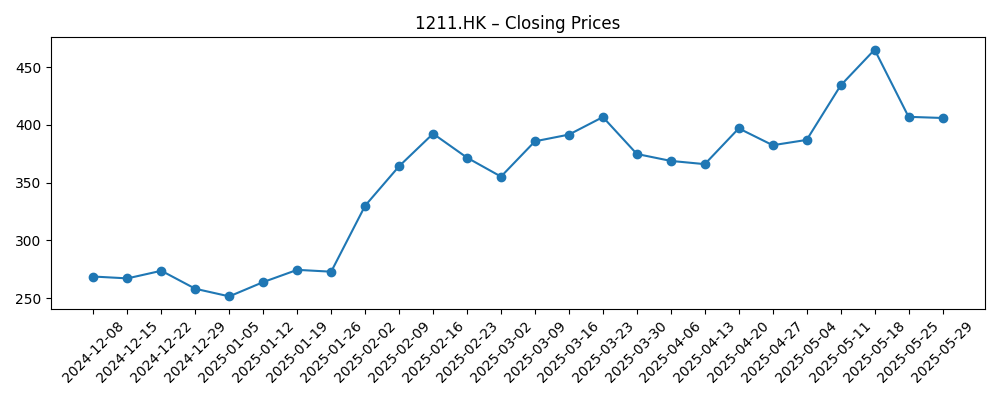
Share price evolution – last 12 months
Notable headlines
- BYD (OTCMKTS:BYDDF) Shares Down 2.5% [ETF Daily News]
- EV Battery Company Evaluation Report 2024-2025: CATL, BYD and LG Energy Solution dominate [GlobeNewswire]
- Reviewing Porsche Automobil and BYD [ETF Daily News]
- BYD & Mercedes-Benz Group head‑to‑head contrast [ETF Daily News]
- BYD vs. Hyundai Motor head‑to‑head survey [ETF Daily News]
- Short interest in BYD Co., Ltd. (BYDDY) grows by 4,486.8% [ETF Daily News]
Opinion
Momentum and positioning around the split frame BYD’s current tape. The stock rallied off late‑2024 lows (weekly closes near 84–92 in November–December) and surged through early 2025, with February–May weekly closes as high as 155.07 on May 18 before cooling. Since late May, a series of lower highs and a drift toward the 200‑day average (115.243) culminated in a 115.10 close on August 27, 2025, a level that often acts as a sentiment pivot. The 50‑day average at 120.800 sits modestly above spot, while a low 0.33 beta points to more idiosyncratic drivers. Headlines noting a jump in short interest on BYDDY and weekly swings around the July 30, 2025, 6:1 split suggest positioning—and not just fundamentals—has influenced the tape. In the near term, reclaiming the 50‑day average with rising volume would support a constructive three‑year setup.
Under the surface, fundamentals argue for resilience but not complacency. BYD’s scale (TTM revenue 822.52B) and integration deliver a strong 23.07% ROE, yet profitability remains industry‑typical at this stage: 5.45% net margin and 4.95% operating margin. Cash of 153.39B comfortably exceeds total debt of 41.13B, but the current ratio at 0.81 and levered free cash flow of -13.38B highlight working‑capital intensity and investment in capacity, software, and international distribution. The dividend appears measured (payout ratio 20.60%; forward yield 1.23% with a 6/10/2025 ex‑date), signaling confidence without compromising flexibility. For the three‑year horizon, the crux is translating rapid revenue growth (36.30% yoy most recent quarter) into durable, self‑funded expansion—i.e., improving cash conversion while defending unit economics amid price competition.
Strategically, recent coverage contrasting BYD with Mercedes‑Benz, Hyundai, and Porsche underscores a broadening competitive lens: BYD is now benchmarked by global incumbents, not just domestic peers. Battery research placing BYD among top innovators supports the thesis that cost leadership and technology roadmaps can sustain share gains outside China across passenger cars, commercial vehicles, and stationary storage. Execution risks remain—regional tariffs, certification timelines, and dealer/service buildouts—but adjacency into energy storage can smooth cycles and deepen vertical efficiencies. Over three years, success likely hinges on overseas mix and premiumization offsetting headline price wars at home, with software, driver assistance, and aftersales contributing to margin depth without overburdening capital intensity.
Valuation signals are mixed but constructive for a patient view. Price performance over the past year (+56.11%) outpaced broad benchmarks, yet the recent consolidation near the 200‑day average resets expectations. Institutional ownership of 42.40% suggests ample sponsorship, while low beta cushions macro swings. What would rerate shares higher over a three‑year window? Clear evidence of positive free cash flow inflection, sustained revenue growth ahead of the sector, and modest margin expansion from today’s 5.45% net and 4.95% operating levels. Conversely, renewed sector‑wide price cuts or external trade frictions could extend the cash conversion lag. With a steady dividend framework and a larger post‑split float, the setup favors accumulation on execution milestones rather than momentum chases.
What could happen in three years? (horizon August 2025+3)
| Best case | Overseas mix and energy storage scale improve pricing power; operating discipline lifts margins, and cash conversion turns positive while maintaining growth. Technology leadership in batteries supports cost advantages and model cadence, underpinning durable share gains. |
| Base case | Revenue growth moderates from recent highs as the market normalizes; margins grind modestly higher through mix and efficiency. Investment remains elevated but manageable, with balance sheet strength intact and dividend policy unchanged. |
| Worse case | Heightened price competition and trade barriers pressure unit economics; working‑capital needs persist and free cash flow stays negative, delaying international scale‑up and capping multiple expansion. |
Projected scenarios are based on current trends and may vary based on market conditions.
Factors most likely to influence the share price
- China EV pricing dynamics and competitive intensity affecting current 5.45% net and 4.95% operating margins.
- Export market access and policy/tariff developments influencing overseas mix and delivery cadence.
- Battery technology and cost curve leadership; execution in energy storage to diversify earnings.
- Cash conversion and liquidity: 153.39B cash vs 41.13B debt, current ratio 0.81, and levered free cash flow at -13.38B.
- Capital allocation and market structure: 6:1 stock split (7/30/2025), dividend stance (20.60% payout; 1.23% forward yield), and short‑interest dynamics.
Conclusion
BYD’s three‑year outlook balances clear strategic strengths with execution tests typical of a fast‑scaling manufacturer. The company enters the period with robust TTM revenue of 822.52B, sector‑beating growth (36.30% yoy in the most recent quarter), and a strong 23.07% ROE backed by vertical integration in EVs and batteries. Yet profitability remains mid‑cycle, and cash conversion is the swing factor: negative levered free cash flow (-13.38B) and a 0.81 current ratio point to ongoing investment and working‑capital demands. The balance sheet’s 153.39B cash buffer and modest leverage (41.13B debt; 16.71% debt/equity) provide flexibility to fund expansion, while a measured dividend (1.23% forward yield; 20.60% payout) rewards patience. With shares consolidating near the 200‑day average after a 6:1 split, evidence of sustained overseas traction, operational efficiency, and improving free cash flow would support a constructive three‑year rerating. Conversely, renewed price wars or trade frictions could elongate the margin rebuild.
This article is not investment advice. Investing in stocks carries risks and you should conduct your own research before making any financial decisions.


