Hyundai Motor (005380.KS) enters the next three years with solid top-line momentum but mixed cash signals. Over the last twelve months, revenue reached 182,250B, supported by 7.3% year‑on‑year quarterly revenue growth, while profit margin stands at 6.30% and operating margin at 7.46% (ttm). Return on equity is 10.64%. Liquidity is tight (current ratio 0.77) amid 26,500B in cash against 155,370B in total debt and a negative operating cash flow of -5,930B (ttm), partly offset by 954.46B in levered free cash flow. The stock closed at ₩221,500 on 1 September 2025, within a 52‑week range of ₩175,800–₩259,000, leaving the 52‑week change at -10.57% and beta at 0.89. A forward dividend of ₩10,000 per share (4.55% yield; payout ratio 23.96%) anchors returns as investors weigh EV execution and macro policy risks.
Key Points as of September 2025
- Revenue and earnings: ttm revenue 182,250B; gross profit 35,670B; EBITDA 16,850B; net income 10,220B.
- Profitability: profit margin 6.30%; operating margin (ttm) 7.46%; ROE 10.64%; ROA 2.64%.
- Sales/Backlog proxy: quarterly revenue growth (yoy) 7.30% vs quarterly earnings growth (yoy) -24.50%; no backlog data provided.
- Liquidity & leverage: cash 26,500B; total debt 155,370B; current ratio 0.77; total debt/equity 127.84%.
- Cash flows: operating cash flow (ttm) -5,930B; levered free cash flow (ttm) 954.46B.
- Dividend: forward annual dividend ₩10,000/share; forward yield 4.55%; payout ratio 23.96%; ex-dividend date 2025-08-28.
- Share price: ₩221,500 (2025-09-01); 52‑week range ₩175,800–₩259,000; 52‑week change -10.57%; 50‑day MA 213,440; 200‑day MA 204,477; beta 0.89.
- Market cap: roughly ₩44.7T based on 202.01M shares and the latest close.
- Analyst/investor view: no formal consensus provided; focus on EV/software execution, cash conversion, and policy risks.
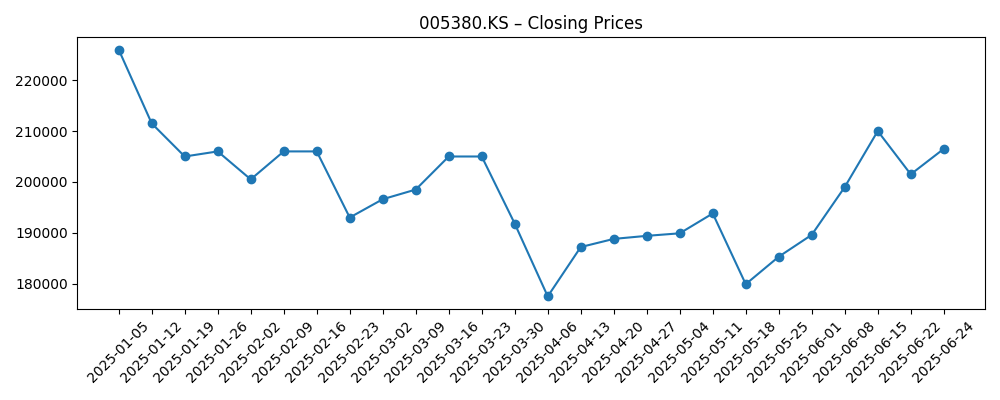
Share price evolution – last 12 months
Notable headlines
Opinion
Price action suggests stabilizing sentiment. From a six-month trough near ₩177,500 in early April, shares recovered to ₩221,500 by 1 September and now trade above both the 50‑day and 200‑day moving averages (₩213,440 and ₩204,477). This technical improvement contrasts with a still-negative 52‑week change of -10.57% and a wide 52‑week range of ₩175,800–₩259,000. Fundamentally, the company shows decent resilience: quarterly revenue growth of 7.30% and ttm operating margin of 7.46% frame a business that is holding pricing and mix reasonably well. Beta at 0.89 underscores lower volatility than the broader market, which can appeal in an uncertain macro backdrop. Over a three‑year horizon, sustaining this regained momentum will likely hinge on the pace of EV adoption, competitive pricing discipline, and the company’s ability to keep its most profitable vehicle lines running at healthy utilization.
The core debate for equity holders is cash conversion. The ttm operating cash flow is negative (-5,930B) even as levered free cash flow is positive (954.46B). That combination points to working-capital swings and capital intensity that need managing, especially with the current ratio at 0.77 and total debt at 155,370B. With a forward dividend of ₩10,000 per share (4.55% yield) and a payout ratio of 23.96%, capital returns look sustainable if cash generation normalizes, but dividend flexibility tightens if operating cash flow remains negative. The balance sheet includes 26,500B in cash, providing a buffer but not a license for complacency. Over the next three years, investors will watch for evidence of structurally positive operating cash flow, a steadier investment cadence, and incremental deleveraging to reduce sensitivity to cyclical shocks.
Software credibility is increasingly central to the brand, and the headline about charging £49 to patch an Ioniq 5 security flaw fits squarely into that narrative. On the one hand, charging for patches can signal cost discipline and a push toward software monetization; on the other, it risks consumer pushback if fixes are perceived as addressing safety or security issues that should be remedied at no cost. For investors, the takeaway is less about this single fee and more about the company’s emerging software posture: over‑the‑air update policies, responsiveness to vulnerabilities, and the balance between monetization and goodwill. Over a multi‑year horizon, strong software trust can support pricing power, brand loyalty, and residual values—factors that in turn stabilize margins and reduce incentive spend, particularly as EV and connected‑car penetration deepens.
External variables remain meaningful. Trade and tariff policy, battery input costs, and foreign exchange can all move the needle on earnings without any change in showroom traffic. The company’s beta of 0.89 suggests the share may be less whipsawed than higher‑beta auto peers, yet policy shifts can still alter regional profit pools rapidly. Within three years, the base case is that operating margins hold around current ttm levels as EV mix grows and supply chains continue to normalize, while top line benefits from pricing discipline and new model cadence. Upside depends on faster software/services monetization and improved cash conversion; downside comes from prolonged discounting, elevated warranty/software costs, or policy headwinds. In short, the operational levers are identifiable, but consistent execution—particularly on software, cash flow, and product mix—will likely define the equity story into 2028.
What could happen in three years? (horizon September 2025+3)
| Scenario | Operating performance | Capital & cash flow | Equity view |
|---|---|---|---|
| Best | EV and high‑margin models scale smoothly; margins hold near current ttm levels or better with stable pricing and lower input volatility. | Operating cash flow turns sustainably positive; disciplined capex keeps levered free cash flow positive; gradual deleveraging. | Re‑rating toward the upper end of the 52‑week range as cash returns and software credibility improve. |
| Base | Revenue grows modestly with steady demand; margins broadly around current ttm levels as competition intensifies but costs normalize. | Cash conversion improves from recent weakness; dividend maintained in line with the current payout framework. | Total return driven by dividend plus mid‑single‑digit price appreciation, tracking execution evidence and macro backdrop. |
| Worse | Price competition and policy headwinds compress earnings; warranty/software costs weigh on profitability. | Operating cash flow stays under pressure; leverage creeps higher; capital returns constrained to preserve balance sheet. | Valuation drifts toward the lower end of the recent trading range until confidence in cash generation is restored. |
Projected scenarios are based on current trends and may vary based on market conditions.
Factors most likely to influence the share price
- Cash conversion and working‑capital discipline relative to recent negative operating cash flow.
- EV adoption, product mix, and pricing power versus intensifying global competition.
- Software and cybersecurity execution, including customer response to update/patch policies.
- Trade and tariff policies in key markets, plus battery/raw‑material cost trends.
- Currency movements (KRW versus major trading partners) impacting export profitability.
- Capital allocation: dividend continuity (₩10,000 forward rate), potential buybacks, and deleveraging pace.
Conclusion
Hyundai Motor’s investment case into 2028 rests on balancing resilient operations with better cash discipline. The company posts solid ttm profitability metrics—6.30% profit margin and 7.46% operating margin—alongside 7.30% quarterly revenue growth, yet negative operating cash flow and a tight current ratio highlight execution risk. The stock’s recovery above its 50‑ and 200‑day moving averages and a forward dividend yield of 4.55% provide support, while a 52‑week range of ₩175,800–₩259,000 underscores ongoing uncertainty. Over three years, the most plausible path is steady margins around current levels, gradual normalization of cash generation, and measured capital returns. Upside comes from software/services traction and a cleaner cash profile; downside centers on policy or pricing shocks, and software or warranty costs. With beta at 0.89 and a roughly ₩44.7T market capitalization, the shares offer a balanced exposure to global autos for investors comfortable monitoring cash flow trends and EV/software execution.
This article is not investment advice. Investing in stocks carries risks and you should conduct your own research before making any financial decisions.