


Sony Group (6758.T) enters September 2025 with shares up 58.60% over 12 months, outpacing the S&P 500’s 15.29%. The stock closed at ¥4,268 on Sept 29, 2025, near its ¥4,578 52‑week high and above the 50‑day and 200‑day moving averages. Under the hood, trailing twelve‑month revenue sits at ¥13.01T with operating margin 13.03% and profit margin 8.81%—a solid base for a diversified portfolio spanning games, music, pictures and image sensors. Cash and debt are roughly balanced (¥1.6T and ¥1.61T), operating cash flow is healthy at ¥2.53T, though levered free cash flow is negative, flagging elevated investment needs. With beta at 0.78 and a modest forward dividend yield of 0.57% (ex‑div 9/29/2025), risk appears measured. This three‑year outlook assesses scenarios to September 2028, key risks, and potential catalysts.
Key Points as of September 2025
- Revenue: TTM at ¥13.01T; quarterly revenue growth (YoY) at 2.20%.
- Profit/Margins: Gross profit ¥3.74T; operating margin 13.03%; profit margin 8.81%; EBITDA ¥1.92T; net income ¥1.19T.
- Cash, debt and liquidity: Cash ¥1.6T vs debt ¥1.61T; current ratio 1.09; Debt/Equity 18.76%.
- Cash generation: Operating cash flow ¥2.53T; levered free cash flow −¥1.98T, indicating high investment outlays.
- Sales/Backlog: Backlog not disclosed here; revenue per share ¥2,158.73 and 2.20% YoY revenue growth suggest steady demand.
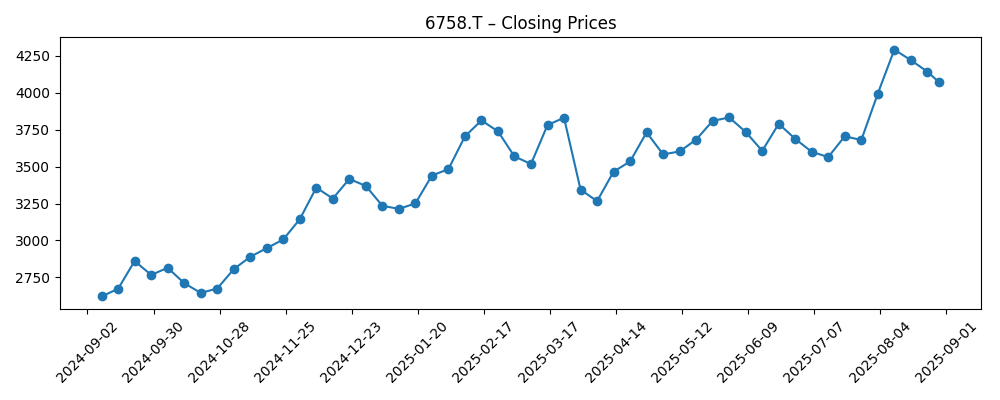
- Share price: ¥4,268 (2025‑09‑29); 52‑week high ¥4,578 and low ¥2,631.50; trades above 50‑DMA (¥4,004.24) and 200‑DMA (¥3,667.82); beta 0.78.
- Dividend: Forward rate ¥25; forward yield 0.57%; payout ratio 10.18%; ex‑dividend date 2025‑09‑29.
- Ownership & liquidity: Shares outstanding 5.98B; float 5.95B; institutions hold 47.77%; 3‑month avg volume 13.38M (10‑day 16.72M).
- Market cap: Large‑cap profile; implied market value from share price and share count places Sony firmly in large‑cap territory.
Share price evolution – last 12 months
Notable headlines
- Tribunal allows Sony India's plea for audit of Tata Play's systems
- UMB Bank n.a. Boosts Stake in Sony Corporation
- NewEdge Advisors LLC Has $1.64 Million Stock Position in Sony Corporation
- Advisors Asset Management Inc. Has $950,000 Stock Position in Sony Corporation
- Wedmont Private Capital Acquires 2,771 Shares of Sony Corporation
- Geneos Wealth Management Inc. Raises Stake in Sony Corporation
- Parallel Advisors LLC Sells 638 Shares of Sony Corporation
Opinion
Sony’s share price has stair‑stepped higher through the past six months, moving from the ¥3,200–3,500 range in early 2025 to ¥4,268 as of Sept 29, 2025, and sitting above both 50‑ and 200‑day moving averages. That technical backdrop, combined with a 58.60% 52‑week gain and a below‑market beta of 0.78, points to constructive momentum with relatively muted volatility. Fundamentally, the company’s 13.03% operating margin and 8.81% net margin on ¥13.01T of revenue signal resilient unit economics across its games, music, pictures and imaging franchises. The key tension for the next three years is whether this operating performance translates into durable free cash flow; current levered FCF is negative despite strong operating cash generation, implying heavy investment or acquisition spending that needs to earn its keep.
The legal development in India—permission to audit Tata Play’s systems—underscores Sony’s willingness to enforce rights and improve monetization in media distribution. While the financial impact is not quantified here, successful audits can tighten reporting, reduce leakage, and improve revenue recognition over time. In a three‑year horizon, stronger control over downstream partners in growth markets could support mid‑single‑digit revenue expansion without requiring large capital outlays. Conversely, if audits uncover disputes that drag into litigation, timing of collections may be lumpy. Given the group’s diversified cash engines and modest payout ratio (10.18%), Sony has flexibility to ride out timing issues, but investor perception will hinge on visible progress in cash conversion from these initiatives.
Institutional flow headlines show incremental accumulation by various advisors alongside small trims, suggesting balanced but constructive positioning. With institutions holding 47.77% and average trading volume rising (10‑day above 3‑month), liquidity supports ongoing buy‑and‑hold as well as tactical interest. Over the next three years, a stable ownership base can dampen drawdowns during cyclical pauses—especially helpful for a conglomerate tied to console cycles, content slates, and smartphone image‑sensor demand. The forward dividend yield of 0.57% and a low payout ratio leave room for gradual dividend growth or opportunistic buybacks if free cash flow normalizes. The market will likely reward clearer capital allocation signals—prioritizing projects that lift ROE (14.44% TTM) while protecting the balance sheet.
The swing factor is cash discipline. Operating cash flow of ¥2.53T demonstrates underlying earnings quality, yet negative levered free cash flow (−¥1.98T) highlights investment intensity. If capex and M&A are calibrated toward high‑return franchises—premium first‑party titles, image sensors tied to higher‑end devices, and evergreen music catalogs—then margin mix could improve and free cash flow could inflect positive within 12–24 months. If investment payoffs are delayed, Sony may lean on its solid liquidity, but valuation could stall near the current range even with healthy EBITDA (¥1.92T). With the stock near its 52‑week high and above key moving averages, execution on cash conversion will likely determine whether shares can sustain an upward channel into 2026–2028.
What could happen in three years? (horizon September 2025+3)
| Scenario | Assumptions | Implications |
|---|---|---|
| Best | Console and content cycle stays favorable; image‑sensor demand recovers; tighter partner controls (e.g., audits) lift monetization; investment outlays ease. | Operating margin remains solid; levered free cash flow turns positive and scales; dividend capacity improves; shares sustain outperformance vs market with lower‑than‑average volatility. |
| Base | Steady game and music pipelines; mixed handset demand; ongoing investment but more selective; balanced institutional ownership. | Revenue growth tracks low–mid single digits; margins broadly stable; cash conversion improves gradually; shares trade near‑to‑above long‑term averages with episodic pullbacks. |
| Worse | Console down‑cycle overlaps with weak smartphones; content slate delays; legal frictions extend collections; investment remains heavy. | Margins compress; levered free cash flow stays negative; dividend growth slows; shares underperform and revisit prior support levels. |
Projected scenarios are based on current trends and may vary based on market conditions.
Factors most likely to influence the share price
- Execution on cash conversion: turning strong operating cash flow into sustained positive free cash flow.
- Cycle timing: PlayStation engagement, first‑party title cadence, and image‑sensor demand from premium smartphones.
- Content monetization and enforcement: outcomes from audits (e.g., Tata Play) and licensing effectiveness across markets.
- Capital allocation: pace and return of capex/M&A versus dividends/buybacks given a 10.18% payout ratio.
- FX and macro: yen moves and consumer demand cycles affecting export earnings and media spending.
- Competitive dynamics: pricing and platform strategies in consoles, streaming, and sensors.
Conclusion
Sony’s investment case into September 2028 rests on a simple equation: defend margins, convert more of its sizable operating cash flow into free cash flow, and keep capital focused on the highest‑return franchises. The current snapshot is encouraging—healthy operating metrics (13.03% operating margin, 8.81% profit margin) on ¥13.01T revenue, balanced cash and debt, and a stock that has outperformed with below‑market beta. Yet negative levered free cash flow is the watch‑item. If management can temper outlays and tighten monetization (including partner audits) while maintaining content and sensor roadmaps, the base case is steady growth with improving cash returns. Institutional interest and liquidity provide a supportive backdrop, and a modest dividend leaves optionality. On balance, risk‑reward appears reasonable for long‑term holders, with cash‑discipline execution likely to determine whether the next three years deliver durable multiple expansion or a range‑bound consolidation.
This article is not investment advice. Investing in stocks carries risks and you should conduct your own research before making any financial decisions.


