
Procter & Gamble enters late 2025 with resilient fundamentals and a stock that has lagged the broader market. The consumer‑staples giant generated $84.28B in trailing 12‑month revenue and $15.68B in net income, supported by a 25.15% operating margin and 18.95% profit margin. Cash generation remains strong, with $17.82B in operating cash flow and $11.38B in levered free cash flow, helping fund a forward annual dividend of $4.23 (2.69% yield; payout ratio 62.62%). Shares recently closed at $158.63, down 9.29% over 52 weeks versus the S&P 500’s 16.73% gain, while the stock’s 0.36 beta underscores its defensive profile. With quarterly revenue growth at 1.70% and quarterly earnings growth at 15.20% year over year, the three‑year outlook hinges on sustaining margin discipline, product innovation, and execution amid changing consumer demand.
Key Points as of September 2025
- Revenue: TTM sales of $84.28B; revenue per share 35.86; quarterly revenue growth 1.70% year over year.
- Profit/Margins: Gross profit $43.27B; operating margin 25.15%; profit margin 18.95%; EBITDA $24.46B; ROE 31.24%; ROA 10.91%.
- Sales/Backlog: No formal backlog in consumer staples; steady demand with OCF $17.82B and LFCF $11.38B; current ratio 0.70.
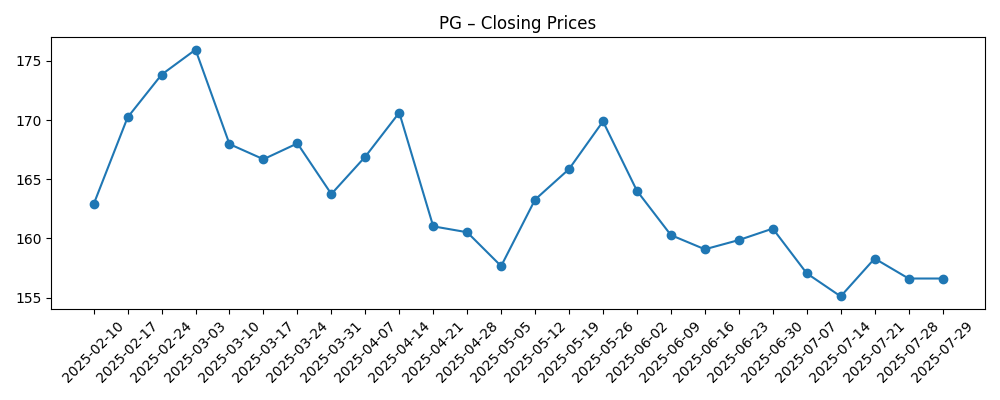
- Share price & trading: Recent close $158.63; 52‑week high/low $180.43/$149.91; 52‑week change −9.29%; 50‑day and 200‑day moving averages $156.41 and $164.10; Avg vol (3M/10D) 7.87M/6.05M; Beta 0.36.
- Dividend/Capital returns: Forward dividend rate $4.23 (2.69% yield); trailing dividend $4.08 (2.59%); payout ratio 62.62%; ex‑div 7/18/2025; paid 8/15/2025.
- Capital structure/Liquidity: Total debt $36.53B; debt/equity 69.86%; total cash $9.56B; book value per share 21.88.
- Ownership & short interest: Shares outstanding/float 2.34B; institutions hold 70.21%; insiders 0.07%; short interest 17.25M (0.74% of float; short ratio 2.42).
- Market cap: Large, mega‑cap consumer‑staples bellwether; implied by 2.34B shares outstanding and recent price.
Share price evolution – last 12 months
Notable headlines
Opinion
P&G’s share performance has trailed the S&P 500 over the past year, a familiar pattern during periods when investors favor cyclicals and higher‑beta growth. With a 0.36 beta and a low short‑interest profile (0.74% of float; short ratio 2.42), the stock remains a core defensive holding rather than a speculative trade. The three‑year setup thus hinges less on market timing and more on compounding: modest top‑line growth, steady margins, and reliable capital returns. If risk appetite rotates back toward quality cash‑flow franchises, the valuation could re‑rate without heroic growth assumptions. Conversely, if the market continues to reward high‑beta stories, PG may continue to underperform on a relative basis while still delivering absolute returns through dividends and gradual earnings expansion.
Margin durability is the linchpin. Today’s 25.15% operating margin and 18.95% profit margin reflect pricing power, productivity, and mix management. Over the next three years, category innovation, premiumization, and disciplined brand investment will need to offset input‑cost and FX variability. Private‑label competition is an evergreen risk, but P&G’s brand equity and scale historically help sustain pricing even as promotional intensity ebbs and flows. Execution around supply‑chain efficiency and media effectiveness should remain center stage. If commodity costs ease, incremental margin tailwinds could accrue; if they rise, P&G’s ability to take price and drive trade‑ups becomes more critical to protecting earnings quality and cash conversion.
Cash generation underpins the equity story. With $17.82B in operating cash flow and $11.38B in levered free cash flow (ttm), P&G has capacity to continue dividend growth while maintaining balance‑sheet flexibility. The payout ratio of 62.62% leaves room for gradual increases so long as earnings expand, and total debt of $36.53B appears manageable relative to scale and profitability. Management’s capital allocation over the next three years will likely balance reinvestment in product, productivity, and selective buybacks. In a base case, dividend growth roughly tracks earnings growth; in a better case, benign input costs and steady volumes could support both higher reinvestment and incremental buybacks without stressing leverage.
Near‑term technicals are mixed but constructive for long‑horizon holders. The shares sit near the 50‑day moving average ($156.41) and below the 200‑day ($164.10), with a 52‑week range of $149.91–$180.43. Fundamentals show low single‑digit revenue growth (1.70% yoy) but stronger earnings momentum (15.20% yoy), consistent with a margin‑led story. Against a defensive backdrop and forward annual dividend of $4.23 (2.69% yield), the path to outperformance likely runs through consistent delivery on innovation and productivity, plus any easing in cost pressures. Should those vectors align, multiple expansion is plausible; if not, the dividend and low volatility should still anchor total returns.
What could happen in three years? (horizon September 2025+3)
| Scenario | Revenue trajectory | Margins and cash | Shareholder returns | Stock implication |
|---|---|---|---|---|
| Best case | Low single–digit organic growth accelerates on innovation and pricing power. | Operating margin sustained near current levels; strong free cash flow supports reinvestment. | Dividend growth continues; buybacks opportunistic while keeping balance sheet prudent. | Multiple expands as defensiveness and execution attract inflows. |
| Base case | Steady low single–digit growth across core categories; occasional FX/commodity noise. | Margins stable with productivity offsets; cash conversion remains healthy. | Dividend grows in line with earnings; neutral buyback cadence. | Stock tracks earnings growth with lower volatility. |
| Worse case | Growth slows as private‑label pressure and weak consumer demand weigh on volumes. | Input‑cost inflation and FX headwinds compress margins; cash generation moderates. | Dividend maintained but growth slows; buybacks curtailed to protect balance sheet. | Valuation de‑rates toward defensive troughs until trends stabilize. |
Projected scenarios are based on current trends and may vary based on market conditions.
Factors most likely to influence the share price
- Commodity and freight cost swings that flow through gross margin and pricing decisions.
- Foreign‑exchange volatility given P&G’s global footprint and reporting currency dynamics.
- Private‑label competition and promotional intensity across key retail partners.
- Innovation cadence, marketing productivity, and digital shelf execution.
- Retailer inventory normalization, category mix shifts, and channel mix (club, e‑commerce, mass).
- Regulatory, ESG, or product‑related litigation that could affect brand equity or costs.
Conclusion
P&G’s three‑year outlook is grounded in consistent cash generation, resilient margins, and disciplined brand building. With $84.28B in TTM revenue, a 25.15% operating margin, and strong free‑cash‑flow support, the company appears well positioned to compound earnings even if category growth remains modest. The forward annual dividend of $4.23 (2.69% yield) and a 62.62% payout ratio suggest continued income support, while a 0.36 beta maintains the stock’s core defensive role in portfolios. Key swing factors include input‑cost trends, FX, and the balance between pricing and volume as consumer elasticity evolves. If management sustains innovation and productivity while holding share, returns should track earnings growth, with potential upside from any easing in costs and a market rotation back to quality defensives. For investors, the case is steady rather than spectacular—anchored by reliability and cash discipline.
This article is not investment advice. Investing in stocks carries risks and you should conduct your own research before making any financial decisions.