


Nestlé (NESN.SW) heads into the next three years balancing income appeal with operational repair. The stock has fallen 16.27% over the past 52 weeks to about 71.14, near the 69.90–91.72 range low. Under the hood, trailing revenue is 90.9B, profit margin 11.34% and operating margin 16.07%, while quarterly revenue and earnings growth are -1.80% and -10.30% year over year. The forward dividend yield is 4.29% on a 3.05 payout and a 76.25% payout ratio. Leverage and liquidity deserve attention: total debt is 65.6B, debt/equity 225.85%, and the current ratio is 0.71, against 5.51B of cash. With a forward P/E of 15.85, EV/EBITDA 13.46 and a beta of 0.42, investors are weighing stability against growth.
Key Points as of September 2025
- Revenue: trailing 12‑month sales of 90.9B; quarterly revenue growth (yoy) at -1.80%.
- Profit/Margins: profit margin 11.34%, operating margin 16.07%; EBITDA 17.56B; quarterly earnings growth (yoy) -10.30%.
- Cash generation: operating cash flow 14.58B and levered free cash flow 5.76B underpin ongoing investment and dividends.
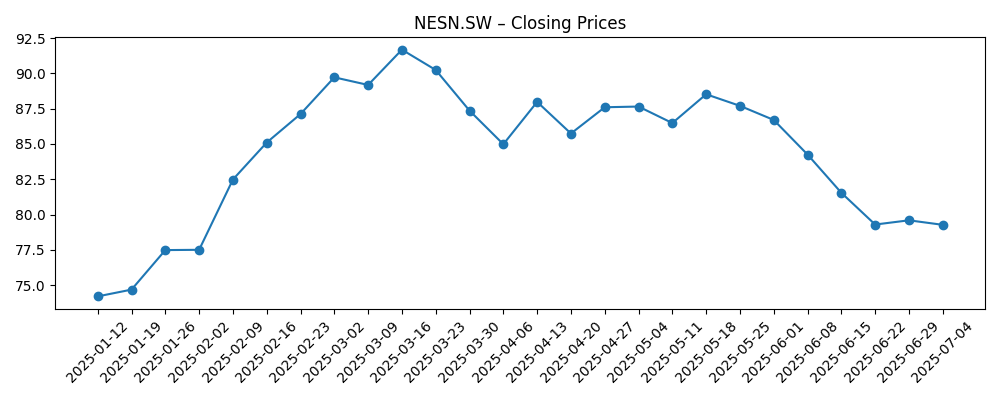
- Share price: ~71.14; 52‑week range 69.90–91.72; 50‑DMA 73.31, 200‑DMA 80.47; beta 0.42.
- Valuation snapshot: forward P/E 15.85, trailing P/E 17.79, PEG (5yr) 4.88, EV/EBITDA 13.46, Price/Sales 2.02, Price/Book 6.35.
- Market cap and enterprise value: 183.02B market cap; 243.11B enterprise value.
- Balance sheet: total debt 65.6B, debt/equity 225.85%; cash 5.51B; current ratio 0.71.
- Dividend: forward annual dividend rate 3.05; forward yield 4.29%; payout ratio 76.25% (dividend date 4/24/2025).
- Ownership and liquidity: float 2.57B; institutions hold 43.77%; average 3‑month volume 3.53M (10‑day 4.14M).
Share price evolution – last 12 months
Notable headlines
Opinion
The past year’s drawdown and the drift toward the bottom of the 52‑week range reflect a market reassessment of Nestlé’s near‑term growth and its ability to defend profitability. The numbers outline the challenge: revenue growth has turned slightly negative and earnings contracted year over year, even as the group maintains double‑digit profit margins. With a forward P/E of 15.85, investors appear to be pricing in modest improvement rather than a sharp rebound. A 4.29% forward dividend yield offers carry, but the 76.25% payout ratio limits flexibility. Against this backdrop, the debate centers on whether self‑help (mix, pricing, productivity) can offset consumer softness and input‑cost noise quickly enough to re‑accelerate EPS.
Balance sheet optics are another swing factor. Total debt of 65.6B and debt/equity at 225.85% are workable for a large, diversified staples company, yet leave less room for aggressive buybacks or large acquisitions without clear payback. Liquidity is tight on current ratio (0.71), making disciplined working‑capital management important. The cash engine still turns—14.58B in operating cash flow and 5.76B in levered free cash flow—supporting the dividend and selective reinvestment. If management prioritizes debt containment and incremental efficiency, the equity story could shift from repair to compounding, even if topline stays subdued.
Valuation can cut both ways. EV/EBITDA at 13.46 and Price/Sales at 2.02 suggest the market still assigns a quality premium to the franchise, supported by a low beta of 0.42. That premium is defendable if margins stabilize and pricing sticks without eroding volumes. Conversely, if pricing power fades while costs remain sticky, the combination of slower revenue and high payout could compress multiples further. The 50‑ and 200‑day moving averages (73.31 and 80.47) frame a technical overhang; sustained closes above the shorter average would be an early signal that fundamentals are inflecting.
Looking three years out, the path of least resistance is a steady, not spectacular, recovery: low growth, gradual margin repair, and consistent cash returns. Upside exists if cost discipline and mix improvements re‑ignite earnings momentum and allow modest deleveraging, which could warrant a re‑rating. Downside stems from prolonged consumer strain or regulatory scrutiny that raises reformulation costs or dents brand equity. Given today’s setup—moderate forward multiple, solid but pressured margins, high payout—the burden of proof sits with execution. Patience may be rewarded, but the next 12–18 months likely determine whether this becomes a yield‑plus‑compounding story or remains a range‑bound income holding.
What could happen in three years? (horizon September 2025+3)
| Case | Operations | Balance sheet & cash | Valuation & shares |
|---|---|---|---|
| Best | Pricing and mix hold; volumes stabilize; margins lift modestly on productivity and simpler portfolio. | Steady free cash flow enables gradual deleveraging while funding the dividend. | Quality premium sustained; sentiment improves; shares trend upward as earnings regain momentum. |
| Base | Low growth with selective category outperformance; margins broadly stable after near‑term volatility. | Cash generation covers reinvestment and dividends; leverage roughly unchanged. | Range‑bound multiple; total return driven mainly by dividend with modest capital appreciation. |
| Worse | Weak consumer demand and cost stickiness pressure volumes and margins; limited pricing power. | Cash flow tightens; optionality for buybacks/investment shrinks; leverage drifts higher. | Multiple compresses; shares lag defensives as investors rotate to stronger growers. |
Projected scenarios are based on current trends and may vary based on market conditions.
Factors most likely to influence the share price
- Execution on pricing, mix, and cost productivity to stabilize margins after recent earnings pressure.
- Input‑cost and FX volatility impacting gross margin and cross‑border purchasing power.
- Regulatory and health‑policy scrutiny of packaged foods that could drive reformulation costs or marketing limits.
- Capital allocation discipline given high payout and leverage—balance between dividends, debt, and reinvestment.
- Consumer demand trends in core geographies, including trade‑down dynamics and private‑label competition.
Conclusion
Nestlé’s investment case over the next three years hinges on turning steady cash generation into visible earnings repair while protecting the dividend. The latest prints show modest revenue contraction and a sharper earnings decline, but margins remain sound for the category. Valuation is not stretched on a forward P/E basis, yet the premium multiples and high payout leave limited room for disappointment. Deleveraging and working‑capital discipline can strengthen resilience, while measured reinvestment and portfolio focus should support pricing and brand equity. With the share price near the lower end of its 52‑week range, risk‑reward skews toward stable income plus selective upside if execution improves. Conversely, a prolongation of weak topline or cost stickiness could keep the stock range‑bound. For long‑term holders, patience and focus on operational milestones may be the right approach.
This article is not investment advice. Investing in stocks carries risks and you should conduct your own research before making any financial decisions.


