


As of October 2025, JD.com balances a sharp revenue rebound with margin and cash‑flow challenges. Trailing 12‑month revenue stands at 1.27T with quarterly revenue growth of 22.40% year over year, yet the operating margin is slightly negative (‑0.30%) and profit margin is 3.06%. Net income totals 38.65B, supported by 124.37B in gross profit and 40.02B in EBITDA. Liquidity is ample (213.84B in cash versus 100.79B in debt; current ratio 1.22), but levered free cash flow is negative (‑14.16B). The stock last closed at 35.86, within a 52‑week range of 29.90–46.44, and is down 17.52% over the past year. A forward annual dividend rate of 1 (2.78% yield; 28.47% payout) underpins shareholder returns, while recent institutional activity suggests a cautious but improving sentiment.
Key Points as of October 2025
- Revenue: 1.27T (ttm); quarterly revenue growth (yoy) at 22.40% signals regained sales momentum.
- Profit/Margins: Profit margin 3.06%; operating margin (ttm) ‑0.30%; EBITDA 40.02B; net income (ttm) 38.65B; quarterly earnings growth (yoy) ‑51.10%.
- Sales/Backlog: Backlog not disclosed; revenue trend implies healthy order flow, supported by JD’s logistics scale.
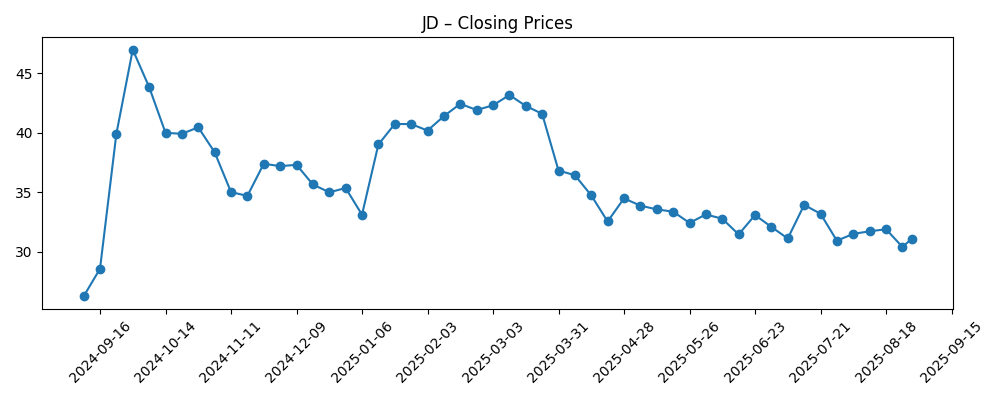
- Share price: Last close 35.86 (10/07/2025); 52‑week range 29.90–46.44; 50‑DMA 32.85; 200‑DMA 35.55; beta 0.40; 52‑week change ‑17.52%.
- Balance sheet: Total cash 213.84B vs total debt 100.79B; current ratio 1.22; debt/equity 33.90%.
- Cash flow: Operating cash flow (ttm) 24.82B; levered free cash flow (ttm) ‑14.16B.
- Dividend & ownership: Forward annual dividend rate 1; yield 2.78%; payout ratio 28.47%; insiders hold 0.79%, institutions 15.23%.
- Short interest: 22.21M shares short (9/15/2025) vs 26.71M prior; short ratio 1.5; short % of float 1.58%.
- Market cap: Not provided in the dataset; reported float and share counts vary.
Share price evolution – last 12 months
Notable headlines
Opinion
JD.com’s share price path over the last six months reflects a market attempting to reconcile strong top‑line recovery with profitability and cash‑flow questions. Weekly closes show the stock sliding from low‑40s in February–March to lows near the low‑30s in June–July before stabilizing around 35.86 by early October. The 50‑day moving average at 32.85 sits below the 200‑day at 35.55, a mildly cautious technical stance, yet the narrowing gap suggests sellers are losing momentum. A 0.40 beta indicates idiosyncratic drivers matter more than broad market swings. Combined with a declining short interest and the recent institutional accumulation headline, the setup suggests sentiment is healing. Still, the 52‑week change of ‑17.52% and the range of 29.90–46.44 underline that confidence remains fragile and will likely hinge on margin stabilization and cash‑flow normalization.
Operationally, the juxtaposition of 22.40% revenue growth with ‑51.10% quarterly earnings growth highlights a classic retail platform trade‑off: gaining share and frequency often requires pricing, promotion, and service investments that compress margins in the near term. The trailing operating margin at ‑0.30% and profit margin at 3.06% imply limited room for error until efficiencies compound. JD’s scale logistics network can be a differentiator on fulfillment speed and cost, but it also demands utilization and disciplined expense control. The company’s 40.02B in EBITDA and 124.37B gross profit show substantial earnings capacity if operating leverage improves. The forward dividend (rate 1; 2.78% yield) is a notable signal of confidence, yet sustaining it over multiple cycles likely depends on converting accounting profits into durable free cash flow.
The balance sheet offers a credible buffer for execution, with 213.84B in cash against 100.79B in debt and a current ratio of 1.22. However, levered free cash flow at ‑14.16B is the core investor concern: persistent cash burn would limit flexibility for investment, returns, or strategic pivots. Management’s ability to translate revenue growth into operating cash flow (24.82B ttm) and then into positive free cash flow will be closely watched. Ownership data (insiders 0.79%, institutions 15.23%) suggests a broad retail and domestic base with room for incremental institutional participation if results de‑risk. The declining short interest to 22.21M and low short ratio (1.5) indicate less aggressive bearish positioning, which could reduce downside pressure into print‑heavy periods.
Over a three‑year horizon, the equity story likely turns on three levers: cost discipline, monetization intensity, and capital allocation consistency. If JD tightens fulfillment and marketing efficiency while holding service levels, incremental operating leverage can emerge even in a competitive environment. Monetization beyond core first‑party retail—via advertising, marketplace take‑rate optimization, and logistics services—could diversify earnings quality. The dividend provides a framework for returns; preserving it through cycles may support a valuation floor. Conversely, a prolonged price war or consumption downdraft could keep margins thin and free cash flow negative, muting multiple expansion. With beta at 0.40, stock‑specific execution should outweigh macro beta, making each quarterly cadence on margins and cash conversion the decisive catalyst for re‑rating.
What could happen in three years? (horizon October 2025+3)
| Scenario | Operations and growth | Profitability and cash | Shareholder stance | Valuation/sentiment |
|---|---|---|---|---|
| Best | Sales momentum endures with broader services monetization and disciplined logistics costs. | Operating efficiency improves; operating cash flow scales and free cash flow turns sustainably positive. | Dividend maintained with scope for incremental returns as balance sheet strength persists. | Confidence rebuilds; stock re‑rates toward the upper end of recent ranges as risks ease. |
| Base | Growth normalizes; competitive intensity remains manageable with selective promotions. | Margins stabilize around current levels with gradual cash‑flow improvement. | Dividend held; capital deployment remains cautious and data‑driven. | Range‑bound trading around longer‑term averages with event‑driven swings. |
| Worse | Prolonged price competition and softer consumption slow sales. | Margins stay pressured; free cash flow remains negative, constraining flexibility. | Dividend policy reassessed to preserve liquidity and investment capacity. | Multiple compresses; shares test the lower end of historical ranges amid weak sentiment. |
Projected scenarios are based on current trends and may vary based on market conditions.
Factors most likely to influence the share price
- Execution on cost control and logistics efficiency translating to margin stabilization from a ‑0.30% operating margin base.
- Cash‑flow trajectory: turning ‑14.16B levered free cash flow positive while maintaining 24.82B operating cash flow momentum.
- Competitive dynamics in China e‑commerce, including pricing intensity and marketplace monetization.
- Policy and regulatory developments affecting large internet platforms and cross‑border listings.
- Capital allocation consistency, notably sustaining the dividend (rate 1; 2.78% yield) through cycles.
- Investor positioning shifts, reflected in short interest trends and institutional ownership changes.
Conclusion
JD.com’s setup into the next three years is a tension between demonstrated demand recovery and the task of converting that growth into resilient earnings and cash. The numbers frame it clearly: rapid topline expansion (22.40% yoy) coexists with thin profitability (3.06% profit margin; ‑0.30% operating margin) and negative levered free cash flow, even as the balance sheet offers meaningful liquidity. Shares have stabilized near the 200‑day moving average after a difficult 12 months (‑17.52%), and declining short interest plus a maintained dividend signal improving confidence. To earn a durable re‑rating, investors will look for operating discipline—particularly in fulfillment, marketing, and marketplace take‑rates—to lift margins and cash conversion while preserving service quality. If JD executes on those levers, the stock could transition from range‑bound to compounding; if not, it may remain sensitive to promotions and macro pulses. Quarterly proof points on margins and cash will be decisive.
This article is not investment advice. Investing in stocks carries risks and you should conduct your own research before making any financial decisions.


