
SAP SE enters the next three years with resilient fundamentals and a share price that has cooled from early‑2025 highs. Over the past 12 months the stock is up 17.39%, but it sits below the 52‑week high of 283.50; the last close was 231.35, versus 50‑ and 200‑day moving averages of 248.23 and 251.08. On fundamentals, trailing‑12‑month revenue stands at 35.89B with an operating margin of 28.46% and a profit margin of 18.23%. Cash of 10.18B exceeds debt of 8.75B, and levered free cash flow (ttm) is 7.37B. Quarterly revenue grew 8.90% year on year and quarterly earnings growth was 91.10%, underscoring operating leverage, while a beta of 0.93 implies below‑market volatility. The forward annual dividend yield is 1.03% (payout ratio 42.27%). This note outlines key drivers and scenarios into September 2028.
Key Points as of September 2025
- Revenue: Trailing‑12‑month revenue is 35.89B; quarterly revenue growth year on year is 8.90%.
- Profit/Margins: Operating margin (ttm) 28.46%; profit margin 18.23%; gross profit (ttm) 26.48B; EBITDA 10.51B; net income (ttm) 6.54B; diluted EPS (ttm) 5.57.
- Sales/Backlog: Growth remains driven by cloud and subscription momentum; backlog not cited here, so watch bookings conversion and renewals.
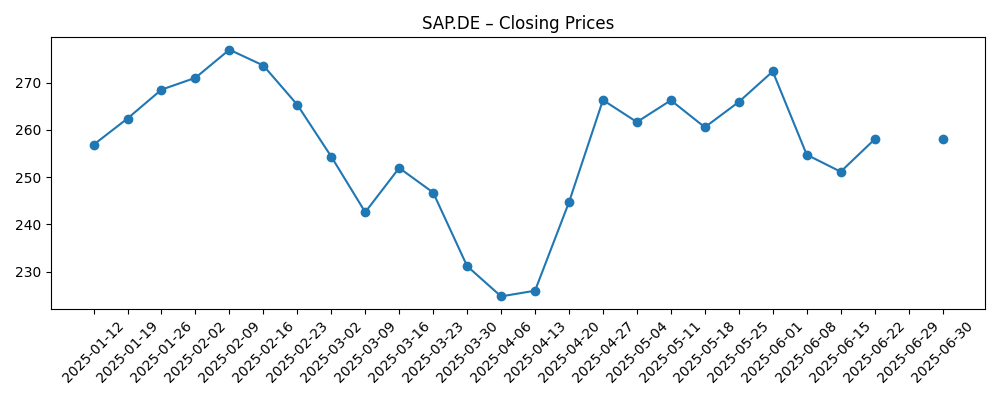
- Share price: Last close 231.35 (Sep 3, 2025); 52‑week high/low 283.50/190.04; 50‑/200‑day MAs 248.23/251.08; 52‑week change 17.39%; beta 0.93.
- Analyst view: Focus on sustaining margin expansion and monetizing AI‑enabled workflows; guidance credibility and execution in cloud transitions remain central.
- Market cap: About 268.4B based on the latest close and 1.16B shares outstanding; float 963.12M; insiders hold 11.31%, institutions 40.41%.
- Liquidity/Leverage: Cash 10.18B vs debt 8.75B (net cash position); current ratio 1.03; operating cash flow (ttm) 7.19B; levered FCF (ttm) 7.37B.
- Dividend/Returns: Forward annual dividend rate 2.35 (1.03% yield); payout ratio 42.27%; last ex‑dividend date 5/14/2025.
Share price evolution – last 12 months
Notable headlines
Opinion
SAP’s share price path through 2025 sets a balanced tone for 2026–2028. After rallying into February, the stock faded below both the 50‑ and 200‑day moving averages (248.23 and 251.08), finishing at 231.35—roughly in the lower half of its 52‑week range. With a beta of 0.93, drawdowns have been orderly rather than dramatic. Turnover has also eased, with 10‑day average volume (1.18M) trailing the 3‑month average (1.37M), a sign that recent weakness has not been driven by capitulation. Technically, the moving averages overhead represent a near‑term credibility test: recapturing them could reset momentum, while repeated failures may extend a consolidation. Absent fresh company‑specific surprises, macro cues and sector flows are likely to steer the stock in the near term, keeping attention on catalysts such as guidance updates and large customer wins.
Fundamentally, the mix of mid‑single‑digit top‑line growth and outsized earnings growth (8.90% vs 91.10% in the most recent quarterly comparisons) implies operating leverage and disciplined cost control. The cash and debt stack is balanced—10.18B in cash versus 8.75B in total debt—with free cash flow (ttm) of 7.37B supporting reinvestment and shareholder returns. With an operating margin of 28.46% and a profit margin of 18.23%, SAP has room to continue funding cloud migration, AI‑enhanced features, and ecosystem partnerships without straining the balance sheet. The 1.03% forward dividend yield and a 42.27% payout ratio provide income support while preserving flexibility. Sustaining double‑digit EPS growth will likely hinge on stable pricing, continued cloud adoption, and tight execution on services delivery to protect margins.
Strategically, enterprise buyers are prioritizing end‑to‑end platforms that embed AI into workflows. For SAP, the investment debate revolves around the pace at which cloud subscriptions can expand wallet share within the installed base and how efficiently that growth converts to cash. The quarterly revenue trend (8.90% growth year on year) is constructive, but investors will scrutinize net new customer adds, renewal quality, and cross‑sell into adjacent modules—especially where AI can command premium tiers. Any acceleration could compress payback periods for go‑to‑market investments, while hiccups in implementation or customer success can quickly elongate sales cycles. With a beta below 1.0, the shares may underreact to exuberant tech tape, but that same defensiveness can be an asset if macro conditions tighten and procurement cycles lengthen.
Into September 2028, a reasonable base case is a steady cadence: mid‑ to high‑single‑digit revenue growth, disciplined cost control, and continued cash generation. The technical backdrop suggests a valuation reset already in progress—shares have lagged their 52‑week peak of 283.50 and sit beneath key moving averages—so delivery against guidance could be the fulcrum for multiple support. Conversely, any slippage in margin trajectory or cloud transition pacing could push the stock to probe the lower end of its 52‑week range (190.04) before a durable bottom forms. The dividend remains a modest but reliable component of total return; its sustainability should not be in doubt given free cash flow, provided capital intensity does not spike. Overall, execution and communication—clear targets, consistent updates—may matter more than bold promises over the 2025–2028 window.
What could happen in three years? (horizon September 2028)
| Scenario | What it looks like in 2028 |
|---|---|
| Best | Cloud adoption within the customer base accelerates, sustaining high single‑ to low double‑digit revenue growth with expanding operating margin. Strong renewal quality and AI‑driven upsell support cash generation, funding product innovation and shareholder returns. Shares reclaim and exceed the prior 52‑week high of 283.50 as confidence in long‑term targets improves. |
| Base | Execution remains steady: revenue growth holds in the mid‑ to high‑single‑digit range, margins are broadly stable, and free cash flow remains healthy. The stock oscillates around longer‑term technical anchors (50‑/200‑day levels of 248.23 and 251.08 used as reference points today), with total return driven by modest appreciation plus the dividend. |
| Worse | Macro softness or execution hiccups slow new bookings and elongate implementations, pressuring margins. Cash generation moderates as working capital swings and higher expenses weigh on results. The stock retraces toward the 52‑week low of 190.04, and valuation resets until growth reaccelerates and guidance credibility is rebuilt. |
Projected scenarios are based on current trends and may vary based on market conditions.
Factors most likely to influence the share price
- Execution of the cloud transition (bookings quality, renewals, and conversion to cash) and its impact on margins.
- Macro demand and enterprise IT budget cycles, including FX impacts on reported growth.
- Competitive intensity in enterprise applications and AI‑enabled features driving pricing and win rates.
- Guidance quality and cadence of updates, especially around growth and margin targets.
- Capital allocation (organic investment, potential M&A, and shareholder returns via dividends/buybacks).
Conclusion
SAP’s setup into 2028 is defined by a sturdy margin profile, improving earnings power, and a stock consolidating after a strong 12‑month climb. The combination of 28.46% operating margin, 18.23% profit margin, and positive net cash provides a buffer to continue investing in cloud and AI initiatives while maintaining a measured dividend (1.03% forward yield; 42.27% payout ratio). Near term, the shares trade below key moving averages (248.23 and 251.08), making delivery against growth and margin expectations the pivotal catalyst for multiple support. An 8.90% quarterly revenue increase and 91.10% earnings growth set a constructive baseline, but sustaining that gap will require consistent execution and healthy renewal dynamics. For long‑term investors, risk‑adjusted appeal rests on visibility into cash conversion and guidance credibility; for traders, reclaiming technical levels would signal renewed momentum.
This article is not investment advice. Investing in stocks carries risks and you should conduct your own research before making any financial decisions.