


Wal‑Mart de México S.A.B. de C. (WMMVY) enters August 2025 with defensible fundamentals but a mixed tape. Trailing 12‑month revenue is 991.14B with a 7.01% operating margin and 5.21% profit margin, supported by 25.14% ROE and 10.19% ROA. Top line grew 8.30% year over year in the latest quarter, while earnings growth slipped −10.30%, reflecting cost and mix pressures. Shares closed the latest week at 30.33, down 6.27% over 52 weeks, between a 24.30–35.78 band; beta is a low 0.22. The company maintains dividend discipline (forward yield 1.91%, trailing 4.23%; ~40% payout) against a balance sheet with 36.21% debt‑to‑equity and a 0.94 current ratio. With cash of 32.44B vs 78.78B debt and 68.07B operating cash flow, investors will watch execution into the next earnings update.
Key Points as of August 2025
- Revenue (ttm): 991.14B; Quarterly revenue growth (yoy): 8.30%.
- Profit/Margins: Operating margin 7.01%; Profit margin 5.21%; EBITDA 94.81B.
- Returns profile: ROE 25.14%; ROA 10.19%.
- Sales/Backlog: Retail model with no backlog metric; quarterly earnings growth (yoy) −10.30%.
- Share price: 30.33 (week ended Aug 8, 2025); 52‑week change −6.27%; 52‑week range 24.30–35.78; 50‑DMA 31.68; 200‑DMA 29.28; beta 0.22.
- Dividend: Forward yield 1.91% (rate 0.58); trailing yield 4.23%; payout ratio ~39.98%.
- Balance sheet: Cash 32.44B; Debt 78.78B; Debt/Equity 36.21%; Current ratio 0.94.
- Ownership/liquidity: Shares outstanding 1.74B; 3‑month average volume ~88.78k; 10‑day ~96.11k.
- Analyst view: Limited public signals; one recent preview flagged upcoming results.
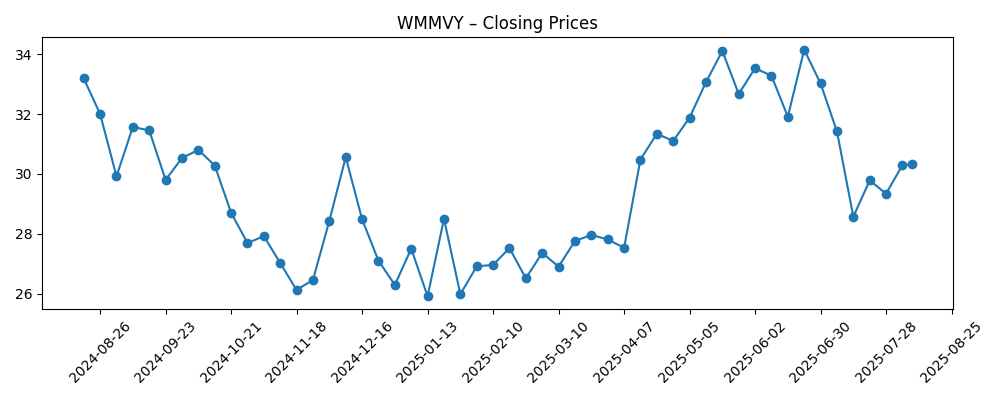
Share price evolution – last 12 months
Notable headlines
Opinion
The near‑term setup hinges on whether upcoming results can reconcile solid top‑line momentum with softer earnings growth. Revenue has expanded at 8.30% year over year, but quarterly earnings growth at −10.30% warns that cost inflation, mix, or investment spend may be diluting operating leverage. That tension showed up in the tape: after a May–June rally that reached 34.15 (week of Jun 23), the stock slipped back to 30.33. A clean print that stabilizes margins around the 7.01% operating run‑rate would likely restore confidence in 2025–2026 earnings durability. Conversely, another margin step‑down could keep the shares range‑bound. Dividend discipline (forward yield 1.91%, payout near 40%) and a low 0.22 beta offer downside dampening, but they do not substitute for earnings momentum in a market that rewarded growth over the past year, as evidenced by the S&P 500’s +18.63% 52‑week advance.
Medium term, we think the growth algorithm still looks serviceable. The company’s scale in Mexico and Central America, everyday‑low‑price positioning, and improving digital capabilities can sustain low‑ to mid‑single‑digit traffic and ticket gains, even without aggressive store expansion. Private‑label penetration and mix management are levers to defend gross profit (238.89B on a trailing basis), while process and automation investments may help hold operating margin near current levels. With operating cash flow of 68.07B, WMMVY appears able to fund maintenance capex, store remodels, and omni‑channel initiatives while supporting the dividend. The key is pacing investment so that near‑term earnings do not lag sales growth for too long. If management can show cadence in cost control and merchandising, investors may begin to underwrite steadier EPS trajectories into 2026–2027.
Balance sheet and capital returns frame the risk‑reward. Net debt remains manageable relative to cash generation (32.44B cash versus 78.78B debt; Debt/Equity 36.21%), though the current ratio at 0.94 underlines the importance of working‑capital discipline in a low‑margin retail model. The payout ratio of 39.98% appears prudent, leaving flexibility to navigate macro shocks while continuing distributions. Sensible capital allocation—prioritizing productivity, supply chain resilience, and customer experience—could compound return on equity, already a robust 25.14%. However, if wage and energy inflation reaccelerate or if competitive intensity forces price investment, the company may need to trade off between margin protection and growth, extending the period of negative earnings growth even as sales expand.
Technically, the stock looks caught between supports and resistances that align with moving averages. The 200‑day moving average at 29.28 has acted as an anchor, while the 50‑day at 31.68 is nearby overhead. A decisive earnings‑driven break above the latter would open room to retest the 2025 highs, whereas a miss could push the shares back toward the lower end of the 24.30–35.78 52‑week band. Given average 3‑month volume of 88.78k ADRs and a low beta, violent swings are less likely absent a major surprise. Over three years, we expect fundamentals—traffic, basket size, and cost discipline—to drive the stock more than sentiment. Execution that narrows the gap between revenue and earnings growth should be the catalyst for multiple stability and a firmer trend.
What could happen in three years? (horizon August 2025+3)
| Scenario | Operating drivers | Revenue/Earnings trend | Dividend policy | Share price implication |
|---|---|---|---|---|
| Best | Consistent traffic gains; private‑label mix; supply chain efficiencies; digital scaling | Sales growth outpaces costs; margins stabilize or improve; earnings growth resumes | Payout sustained with room for periodic increases | Re‑rates toward upper end of historical range; trend bias up |
| Base | Steady consumer demand; balanced pricing; disciplined opex | Sales grow steadily; margins broadly stable around current levels; earnings growth modest | Payout maintained near current ratio; yield supported | Range‑bound around long‑term averages with periodic swings |
| Worse | Cost pressures and FX headwinds; heightened competition | Sales slow; margins compress; earnings stay under pressure | Payout conserved; limited growth in distributions | Tests lower band of 52‑week range; de‑rating risk |
Projected scenarios are based on current trends and may vary based on market conditions.
Factors most likely to influence the share price
- Margin trajectory relative to revenue growth, given recent −10.30% earnings growth yoy against 8.30% sales growth.
- FX and inflation dynamics affecting purchasing power, costs, and ADR translation.
- Competitive intensity and pricing strategy across formats and online channels.
- Capital allocation discipline: sustaining a ~39.98% payout while funding operations and growth.
- Supply chain efficiency and inventory management supporting the 7.01% operating margin.
- Liquidity and sentiment shifts around earnings dates and corporate updates.
Conclusion
WMMVY’s investment case into 2028 rests on pairing steady sales growth with better earnings conversion. The company exhibits strong structural advantages and sound returns on capital, with 25.14% ROE, a conservative payout framework, and operating cash flow of 68.07B to fund ongoing initiatives. Yet the divergence between 8.30% revenue growth and −10.30% earnings growth highlights the main debate: costs, mix, and investment need to be right‑sized to stabilize margins. Technically and fundamentally, the stock appears set for a prove‑it phase: the 200‑day moving average (29.28) offers a reference point, and a catalyst—such as a solid earnings print—could shift the trajectory toward the upper end of the 52‑week range. For long‑term holders, low beta and dividend support can cushion volatility, but sustained execution will be required to re‑rate the shares meaningfully.
This article is not investment advice. Investing in stocks carries risks and you should conduct your own research before making any financial decisions.


