


Wilmar International (F34.SI) enters the next three years with value‑style metrics and a cyclical backdrop. The stock trades near 2.88, toward the 52‑week range of 2.87–3.47, and is down 6.17% over the past year while the S&P 500 rose 15.22%. On fundamentals, the group generated 69.34B revenue (ttm), 1.19B net income and 3.51B EBITDA, implying a 1.71% net margin and 6.79x EV/EBITDA on a 38.74B enterprise value. Market cap stands at 17.98B, with a trailing P/E of 11.88 and forward P/E of 11.82. Cash of 12.92B offsets part of 29.38B total debt; current ratio is 1.16. Yield‑oriented holders note a forward dividend of 0.14 (4.86% yield; ex‑dividend 8/19/2025). With beta of 0.23 and insider ownership at 70.08%, Wilmar offers defensive characteristics if margins stabilize.
Key Points as of August 2025
- Revenue: TTM 69.34B; quarterly revenue growth (yoy) 6.30%; revenue per share 11.08.
- Profit and margins: Net margin 1.71%; operating margin 3.46%; gross profit 5.37B; EBITDA 3.51B; quarterly earnings growth (yoy) 2.60%.
- Cash flow and leverage: Operating cash flow 1.38B; levered free cash flow 649.89M; total debt 29.38B; debt/equity 126.02%; cash 12.92B; current ratio 1.16.
- Valuation: Market cap 17.98B; enterprise value 38.74B; EV/Revenue 0.44; EV/EBITDA 6.79; P/E 11.88; forward P/E 11.82; PEG 1.39; price/sales 0.20; price/book 0.68.
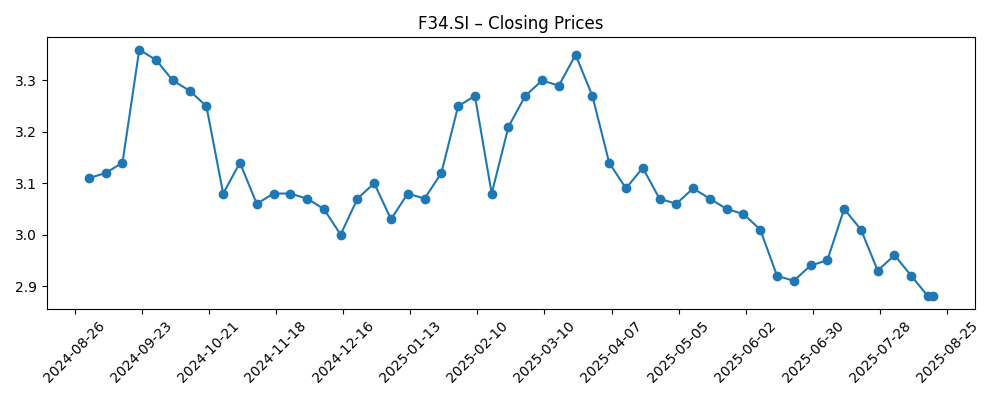
- Share price and trading: Recent price near 2.88; 52‑week range 2.87–3.47; 50‑day MA 2.9606; 200‑day MA 3.0865; 52‑week change −6.17%; beta 0.23.
- Ownership and float: Shares outstanding 6.24B; float 1.78B; insiders hold 70.08%; institutions 6.74%.
- Dividend: Forward annual rate 0.14; forward yield 4.86%; payout ratio 64.81%; 5‑year average yield 4.16; ex‑dividend date 8/19/2025.
- Liquidity: Average volume (3m) 6.54M; average volume (10d) 6.79M.
Share price evolution – last 12 months
Notable headlines
Opinion
Wilmar’s investment case over the next three years hinges on whether thin but resilient processing margins can be preserved across cycles. With trailing P/E 11.88, price/book 0.68 and price/sales 0.20, valuation screens inexpensive relative to the size and integration of the franchise. Yet profitability remains narrow (1.71% net margin; 3.46% operating margin), so small swings in crush and refining spreads can move earnings. The stock sits near 2.88, close to the lower end of the 2.87–3.47 range, and the 52‑week change is −6.17% against a 15.22% rise in the S&P 500. Beta of 0.23 and high insider alignment (70.08% held by insiders) temper volatility, but they also mean the float is limited. If quarterly revenue growth of 6.30% can be sustained while costs are kept in check, a path to gradual margin recovery is plausible.
The balance‑sheet trajectory is just as important. Total debt of 29.38B against 12.92B cash and a debt/equity ratio of 126.02% underscore the need for steady operating cash flow. Over the last twelve months, operating cash flow of 1.38B and levered free cash flow of 649.89M suggest capacity to service obligations, but not ample room for aggressive expansion without recycling capital. Enterprise value of 38.74B and EV/EBITDA of 6.79 indicate that modest improvements in EBITDA can translate into noticeable equity value if deleveraging progresses. A current ratio of 1.16 points to adequate near‑term liquidity, though working‑capital swings typical of agri supply chains can be a swing factor. Over a three‑year horizon, disciplined capex, mix upgrades and selective divestments could slowly tilt the balance toward lower leverage.
Income investors are central to the Wilmar story. The forward annual dividend of 0.14 equates to a 4.86% yield, with a payout ratio of 64.81%. That is supportable if earnings hold, especially given the 0.23 beta and the company’s low valuation. The recent ex‑dividend date (8/19/2025) may keep near‑term trading technicals subdued, but a consistent policy can anchor total returns even if the share price moves sideways. Insider ownership of 70.08% and an institutionally held 6.74% can reduce headline pressure, although they may also limit index‑driven inflows. If management prioritizes free‑cash‑flow accretion over volume, dividend stability is achievable while retaining flexibility for opportunistic debt reduction.
Technically, the stock has drifted below longer trend markers, with a 50‑day moving average of 2.9606 and a 200‑day of 3.0865 framing resistance levels. Recent closes near 2.88 and a 52‑week range of 2.87–3.47 suggest downside is limited by valuation, but catalysts are needed for a rerating. In the absence of notable company‑specific headlines provided here, quarterly prints will likely drive the narrative: investors will watch revenue growth, gross‑to‑net conversion and operating margin discipline (3.46% ttm) closely. A stabilization of margins and confirmation that working capital remains manageable would likely nudge the shares toward the mid‑range of the moving averages; conversely, any squeeze in spreads or higher funding costs could keep the stock range‑bound.
What could happen in three years? (horizon August 2025+3)
| Scenario | Operations | Balance sheet | Shareholder returns / Valuation |
|---|---|---|---|
| Best | Processing spreads hold up and efficiency initiatives lift profitability; revenue momentum is maintained with a richer mix. | Consistent free cash flow supports gradual net‑debt reduction and stronger liquidity buffers. | Dividend maintained with scope for incremental growth; valuation multiples expand from value territory. |
| Base | Margins remain narrow but stable; revenue grows modestly; cost control offsets input volatility. | Leverage broadly stable as operating cash flows fund capex and working‑capital needs. | Dividend maintained; total return led by yield; valuation remains range‑bound. |
| Worse | Spread compression and cost pressures reduce profitability; revenue becomes more volatile. | Working‑capital needs rise and funding costs weigh on liquidity; deleveraging stalls. | Dividend under review or trimmed; valuation drifts lower and the stock lingers near the lower end of its trading range. |
Projected scenarios are based on current trends and may vary based on market conditions.
Factors most likely to influence the share price
- Volatility in processing margins and commodity input/output spreads that directly affect earnings.
- Working‑capital swings and access to funding that influence leverage and liquidity.
- Regulatory and trade‑policy changes across major end‑markets that impact flows and pricing.
- Execution on cost discipline and product‑mix upgrades to support operating margin stability.
- Dividend policy consistency and capital allocation priorities, including any asset recycling.
Conclusion
Wilmar’s near‑term setup is defined by value‑tilted multiples and a defensive profile, but the medium‑term equity story rests on incremental improvement rather than dramatic transformation. At a trailing P/E of 11.88 and price/book of 0.68, the market discounts modest growth and thin margins; sustaining quarterly revenue momentum (6.30% yoy) while holding operating margin around current levels (3.46% ttm) could be enough to unlock gradual rerating, especially if EV/EBITDA compresses from 6.79 through steady deleveraging. Cash of 12.92B versus 29.38B debt and a current ratio of 1.16 call for disciplined capital deployment, yet operating cash flow of 1.38B and levered free cash flow of 649.89M suggest capacity to meet obligations. The 4.86% forward yield (payout 64.81%) provides carry while investors wait for clearer catalysts. On a three‑year horizon, a stable margin environment and balance‑sheet progress point to a constructive, if measured, path; adverse spread moves would keep shares range‑bound.
This article is not investment advice. Investing in stocks carries risks and you should conduct your own research before making any financial decisions.


