


Wilmar International (F34.SI) enters the next three years with a mixed setup: steady top‑line growth, thin margins, and a discounted valuation. Over the past six months the share price drifted toward the lower end of its 52‑week range, even as revenue grew year‑on‑year and cash generation remained positive. Leverage is elevated but manageable, the dividend yield is attractive, and ownership is tightly held, which can temper volatility but also mute near‑term catalysts. With a broad footprint across edible oils, agri‑processing and consumer products, Wilmar remains sensitive to commodity cycles and policy shifts, yet its integrated model provides resilience. This note outlines key metrics as of today and maps best‑, base‑ and worst‑case paths to September 2028, highlighting the variables most likely to move the stock.
Key Points as of September 2025
- Revenue – TTM revenue 69.34B; quarterly revenue growth (yoy) 6.30%; revenue per share 11.08.
- Profit/Margins – Profit margin 1.71%; operating margin 3.46%; EBITDA 3.51B; EV/EBITDA 6.83.
- Sales/Backlog – Price/Sales 0.20; backlog not disclosed.
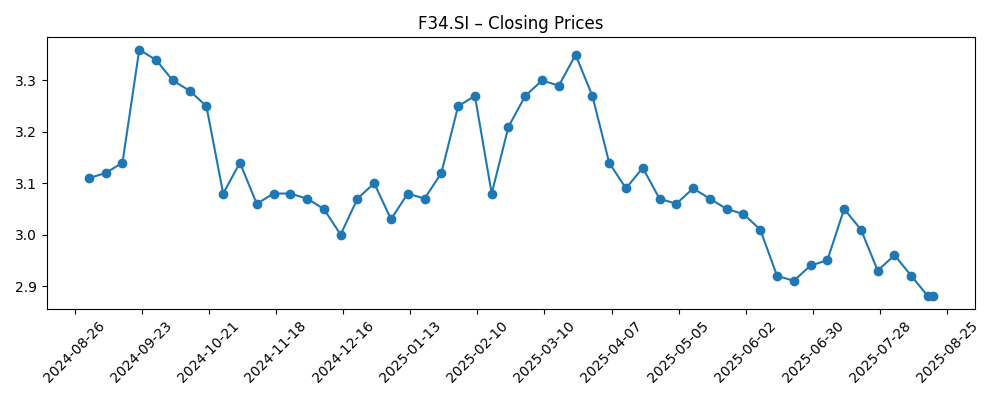
- Share price – Latest weekly close near 2.90 (week of 2025‑09‑14); 52‑week range 2.87–3.47; 52‑week change −7.94%; 50‑day MA 2.9534 vs 200‑day 3.0673; beta 0.25.
- Analyst view – Forward P/E 10.31; trailing P/E 12.01; PEG (5yr expected) 1.21.
- Market cap – 18.10B; enterprise value 38.79B.
- Balance sheet – Cash 12.92B; debt 29.38B; debt/equity 126.02%; current ratio 1.16.
- Cash flows – Operating cash flow 1.38B; levered free cash flow 649.89M.
- Dividend/Ownership – Forward dividend yield 4.83% (ex‑date 2025‑08‑19); payout ratio 64.81%; insiders 70.08%; float 1.78B; avg 3‑mo volume 6.39M.
Share price evolution – last 12 months
Notable headlines
Opinion
Valuation and income define Wilmar’s near‑term investment case. The stock trades at 0.69x book and 0.20x sales, with a forward P/E of 10.31 versus a trailing 12.01, indicating expectations for modest earnings improvement. The PEG of 1.21 suggests growth assumptions are not aggressive, and the forward dividend yield of 4.83% (payout ratio 64.81%) adds carry while investors wait for catalysts. Price action has softened toward the 52‑week low (range 2.87–3.47) and lags broader indices over 12 months (−7.94%), but a low beta of 0.25 supports downside dampening. With insiders holding 70.08% and a float of 1.78B shares, supply dynamics can suppress sharp moves both ways. On balance, the valuation gap and income profile argue for patience; sustained progress on margins and cash generation would be the most credible drivers of a re‑rating over the next 12–18 months.
Margins remain the swing factor. Wilmar’s TTM profit margin of 1.71% and operating margin of 3.46% reflect the inherently low‑margin nature of agri‑processing and the timing effects of commodity price moves. Yet the scale and integration that produce 69.34B of TTM revenue and 3.51B of EBITDA can buffer volatility and create operating leverage if crush spreads and downstream mix improve. At 6.83x EV/EBITDA, the market prices in execution risk but leaves room for upside if earnings quality strengthens. Quarterly revenue growth of 6.30% and earnings growth of 2.60% (yoy) point to incremental progress, albeit uneven. A consistent tilt toward branded consumer products and higher‑value ingredients could lift blended margins, while rigorous inventory and hedging discipline can reduce the amplitude of cycle‑driven earnings swings that have historically constrained valuation multiples.
Balance sheet and cash discipline will shape capital returns. Gross debt of 29.38B against 12.92B cash yields elevated leverage (debt/equity 126.02%) but a current ratio of 1.16 and positive operating cash flow of 1.38B demonstrate liquidity coverage. Levered free cash flow of 649.89M supports the dividend today; sustaining it hinges on working‑capital efficiency and capex pacing through the cycle. Refinancing costs, access to funding, and the cadence of portfolio optimization are critical variables for a company with a 38.79B enterprise value. The ownership structure (70.08% insider) and average 3‑month volume of 6.39M imply orderly trading conditions but fewer event‑driven surges. If management prioritizes balance‑sheet resilience and incremental ROE gains (5.66% ttm), investors may tolerate slow growth in exchange for stable distributions and gradual multiple expansion from current depressed price‑to‑book levels.
Technicals mirror fundamentals: the 50‑day moving average (2.9534) sits below the 200‑day (3.0673), consistent with a cautious trend, while recent weekly closes hovered around 2.90. To reverse that pattern, Wilmar likely needs a sequence of cleaner quarters with improving operating metrics and cash conversion, rather than one‑off gains. Macro helps or hurts at the margin: softer input costs and resilient demand support stabilizing spreads; regulatory changes or trade frictions could do the opposite. With beta at 0.25, the stock may lag in strong risk‑on tapes but can preserve capital in drawdowns, making the carry more valuable. Over a three‑year horizon, a base case of steady growth and balance‑sheet repair could bring the shares closer to book value multiples typical for mature agri‑processors; a best case requires visible margin uplift and faster earnings growth.
What could happen in three years? (horizon September 2028)
| Scenario | Overview |
|---|---|
| Best | Execution on mix upgrade and operating discipline lifts margins and cash conversion. Revenue growth remains steady, earnings quality improves, and leverage trends lower through retained cash flow. Valuation closes part of the gap to peers as investors reward stability and income. |
| Base | Top‑line grows modestly with periodic volatility. Margins oscillate within recent ranges but gradually stabilize. Dividend stays sustainable with prudent capex. Shares track fundamentals and trade around long‑term averages absent major shocks. |
| Worse | Commodity price swings and policy headwinds compress spreads and strain working capital. Cash generation weakens, forcing tighter capital returns and slower deleveraging. Valuation remains subdued as investors demand a higher risk premium. |
Projected scenarios are based on current trends and may vary based on market conditions.
Factors most likely to influence the share price
- Soft‑commodity price and crush‑spread volatility affecting margins and inventory valuation.
- Demand trends and policy shifts in core end‑markets, including regulatory changes impacting trade flows.
- Balance‑sheet management: refinancing costs, leverage trajectory, and working‑capital efficiency.
- Product mix and execution in higher‑margin downstream/consumer segments.
- Capital allocation: dividend sustainability versus reinvestment, and any portfolio optimization or M&A.
Conclusion
Wilmar’s three‑year setup is defined by a straightforward trade‑off: dependable scale and income versus cyclical margins and leverage. The company’s breadth supports steady revenue growth (6.30% yoy in the most recent quarter) and EBITDA generation, yet low headline margins (1.71% profit; 3.46% operating) keep valuation anchored until execution demonstrably improves. Today’s multiples – notably 0.69x book, 0.20x sales, and 6.83x EV/EBITDA – imply the market is cautious but open to re‑rating if cash conversion becomes more consistent and leverage edges down from elevated levels. The dividend yield of 4.83% provides carry, with sustainability tied to working‑capital discipline and capex pacing. With a low beta and concentrated ownership, the stock may move slowly, but that can work in investors’ favor if fundamentals grind better. On a base case, measured improvement earns gradual multiple expansion; in a best case, visible margin uplift could unlock more meaningful upside over the horizon to September 2028.
This article is not investment advice. Investing in stocks carries risks and you should conduct your own research before making any financial decisions.


