


Wal-Mart de México (WMMVY) enters September 2025 with fundamentals that look resilient against a calmer share price. Trailing 12‑month revenue stands at 991.14B with quarterly revenue growth of 8.30% year over year, while profit and operating margins of 5.21% and 7.01% suggest disciplined execution in a competitive retail backdrop. Return on equity at 25.14% and low beta of 0.22 frame a defensive profile. Cash generation remains solid, with 68.07B in operating cash flow and positive levered free cash flow. The stock has consolidated near the low‑30s after a mid‑year rally, and the forward dividend yield of 1.87% with a 39.98% payout ratio underpins income appeal. With debt at 78.78B and a current ratio of 0.94, balance‑sheet flexibility is adequate but requires continued inventory and working‑capital discipline.
Key Points as of September 2025
- Revenue: ttm revenue of 991.14B; quarterly revenue growth (yoy) at 8.30%.
- Profit/Margins: profit margin 5.21%; operating margin 7.01%; ROE 25.14%; ROA 10.19%.
- Sales/Backlog: strong cash generation with operating cash flow 68.07B and levered free cash flow 15.01B.
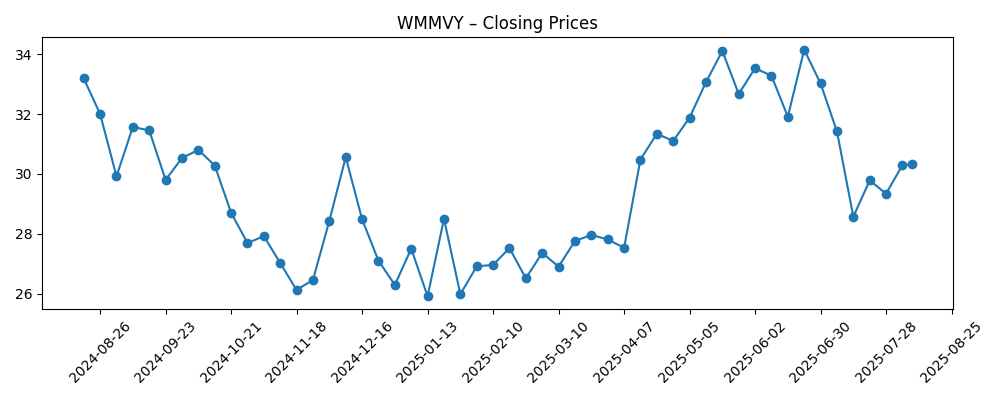
- Share price: recent weekly close near 30.93; 52‑week range 24.30–35.78; 50‑day/200‑day MAs at 30.05/29.56; 52‑week change −4.36% vs S&P 500 +17.41%.
- Dividend: forward dividend rate 0.58 (yield 1.87%); trailing rate 1.30 (yield 4.20%); payout ratio 39.98%.
- Balance sheet: cash 32.44B; total debt 78.78B; debt/equity 36.21%; current ratio 0.94.
- Market cap: implied around 53.8B using ~30.93 price and 1.74B shares outstanding.
- Trading/ownership: low beta (0.22) and light OTC liquidity (avg vol 85.9k 3‑mo; 60.23k 10‑day); institutions hold 0.07%.
- Earnings trend: ttm EPS 1.61; quarterly earnings growth (yoy) −10.30% indicates near‑term margin pressure.
Share price evolution – last 12 months
Notable headlines
Opinion
The stock’s path over the past year sets a constructive but measured tone for a three‑year view. After sliding into late 2024, shares found support and rallied into mid‑2025, with a weekly close peaking near late June before consolidating around the low‑30s. The technical backdrop is neutral: the 50‑day and 200‑day moving averages sit near each other, signaling equilibrium between buyers and sellers. Low beta (0.22) points to dampened volatility, which tends to compress both downside and upside. Liquidity on the OTC line remains modest (3‑month average volume 85.9k), a constraint that can amplify moves in thin periods. Within that context, the 52‑week range of 24.30–35.78 provides a practical frame for risk budgeting while the recent stabilization suggests investors await clearer evidence on growth durability and cost normalization.
Fundamentals are the stronger anchor. Trailing revenue of 991.14B and gross profit of 238.89B reflect scale, while margins of 5.21% (net) and 7.01% (operating) indicate disciplined pricing and expense control amid competitive intensity. Return on equity at 25.14% is robust, supported by healthy operating cash flow (68.07B) and positive levered free cash flow (15.01B). Leverage looks manageable with total debt of 78.78B and debt/equity at 36.21%, though a current ratio of 0.94 argues for continued vigilance on inventory turns and payables timing. If management sustains mid‑single‑digit top‑line growth while protecting gross margin, even modest operating leverage could stabilize earnings. That, in turn, can support steady capital returns without stretching the balance sheet.
Earnings are the swing factor. Quarterly earnings growth at −10.30% year over year contrasts with revenue growth of 8.30%, implying transient cost or mix headwinds. With diluted EPS at 1.61, incremental improvement likely hinges on expense discipline, shrink reduction, purchasing efficiencies, and a balanced promotional stance. The dividend profile is sensible: a forward yield of 1.87% and a 39.98% payout ratio leave room for reinvestment while still rewarding shareholders. Trailing yield optics (4.20%) may reflect timing effects; investors should focus on cash sustainability signaled by operating cash flow. If earnings trajectories converge with sales trends, valuation could re‑rate without heroic assumptions; if not, shares may continue to track the market’s defensive cohort rather than growth leaders.
Sentiment remains mixed but stable. The recent short‑interest update underscores that positioning, not just fundamentals, can nudge near‑term moves—though publicly available short‑interest data on this OTC line is thin. Low institutional ownership (0.07%) and light trading volume can dampen sponsorship but also limit forced flows during broader selloffs. Over a three‑year horizon, the path of least resistance is likely driven by margin stability, cash conversion, and consistent dividend execution. External variables—input costs, pricing intensity, and currency translation—will color quarterly prints. Anchored by low beta and healthy returns on capital, WMMVY appears set for a steady, compounding profile if execution holds, with upside tied to closing the gap between revenue and earnings growth.
What could happen in three years? (horizon September 2025+3)
| Scenario | Outcome by Sep 2028 |
|---|---|
| Best | Revenue growth holds while costs normalize, lifting earnings consistency. Strong cash conversion supports incremental dividend increases and selective reinvestment. The stock earns a quality premium as low volatility and high ROE persist, with trading liquidity gradually improving. |
| Base | Sales expand steadily but margin progress is gradual. Cash flow funds stable dividends and maintenance capex. Shares track fundamentals with modest multiple drift, delivering total returns mainly from earnings compounding and payouts. |
| Worse | Persistent cost pressure and competitive pricing erode margins; working‑capital tightness forces a conservative stance. Dividend growth pauses to protect balance‑sheet flexibility, and the stock lags defensives given thin liquidity and subdued sponsorship. |
Projected scenarios are based on current trends and may vary based on market conditions.
Factors most likely to influence the share price
- Margin trajectory vs. cost inflation (labor, logistics, utilities) and pricing intensity.
- Cash conversion and working‑capital discipline given a current ratio of 0.94.
- Comparable sales momentum and mix effects on gross profit sustainability.
- Currency and macro sensitivity in core markets, affecting translation and demand.
- Capital allocation (dividends vs. reinvestment) relative to earnings stability and leverage.
- Liquidity/ownership structure on the OTC line, which can amplify volatility around news.
Conclusion
WMMVY’s three‑year setup is defined by steady revenue expansion, disciplined margins, and strong returns on capital, tempered by near‑term earnings softness and tight working capital. The business generates ample cash (68.07B operating cash flow) to fund a pragmatic dividend policy—forward yield 1.87% with a 39.98% payout—without overextending the balance sheet (debt/equity 36.21%). Share performance has stabilized near the low‑30s, with low beta signaling a defensive risk profile and thin OTC liquidity capping sponsorship. If earnings re‑align with top‑line growth and cost pressures ease, the combination of ROE resilience and cash discipline argues for a gradual re‑rating. Conversely, prolonged margin pressure could keep the stock range‑bound, with total returns relying on dividends and incremental EPS growth. On balance, WMMVY looks positioned for measured, compounding returns if execution remains consistent.
This article is not investment advice. Investing in stocks carries risks and you should conduct your own research before making any financial decisions.


