


As of September 2025, Unilever Indonesia (UNVR.JK) pairs strong brand equity with a mixed tape of market signals. The shares recently traded near IDR 1,715 within a 52‑week range of 985–2,440 after a volatile six months. On fundamentals, revenue (ttm) is 34.3T with net income of 3.06T, supported by a 14.63% operating margin and 8.91% profit margin. Cash flow remains a pillar (operating cash flow 3.59T; levered free cash flow 1.38T), but topline and earnings momentum are soft (quarterly revenue growth −2.5% YoY; quarterly earnings growth −9.8% YoY). Income investors will note a forward dividend yield of 5.13% against a 110% payout ratio and an ex‑date of June 16, 2025. With a low 5‑year beta of 0.05 and high insider ownership (85%), the stock could remain a defensive staple while management navigates growth and pricing.
Key Points as of September 2025
- Revenue: 34.3T (ttm); quarterly revenue growth −2.5% YoY.
- Profit/Margins: Gross profit 16.01T (ttm); operating margin 14.63%; profit margin 8.91%.
- Earnings: Net income 3.06T (ttm); diluted EPS 79.92; quarterly earnings growth −9.8% YoY.
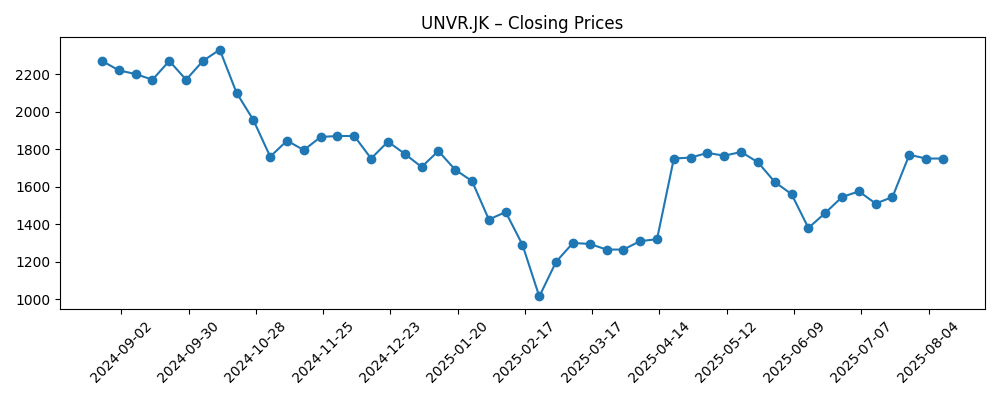
- Share price: Last near IDR 1,715; 52‑week range 985–2,440; 52‑week change −22.40%; beta 0.05.
- Trends: 50‑day / 200‑day moving averages at 1,689.40 / 1,582.50, signaling consolidation above the 200‑day.
- Dividend: Forward rate 88; forward yield 5.13%; trailing rate 47 (2.75%); payout ratio 110%; ex‑date 6/16/2025.
- Balance sheet: Total cash 2T; total debt 1.94T; current ratio 0.50; total debt/equity 75.46%.
- Ownership & liquidity: Insiders 85.00%; institutions 3.96%; float 5.73B; average 3‑month volume 30.06M.
- Market cap (implied): ≈ IDR 65.5T based on ~38.15B shares and ~IDR 1,715 last price.
Share price evolution – last 12 months
Notable headlines
Opinion
The share price path over the past six months reflects a tug‑of‑war between dependable cash generation and softer near‑term growth. Weekly closes fell sharply into late February before rebounding in April, then oscillated through June–August before settling near 1,700 in mid‑September. With a 5‑year beta of 0.05, the stock behaves like a defensive consumer staple, yet the 52‑week change of −22.40% shows that defensiveness has limits when revenue and earnings momentum turn negative. The 50‑day average modestly above the 200‑day suggests stabilization, not a confirmed uptrend. In our view, the next durable leg depends on visible reacceleration in sales, or at least evidence that pricing and mix can offset volume softness without eroding brand equity. Until then, the shares may remain range‑bound, with the dividend providing support and tactical investors trading around moving averages.
Income remains central to the thesis. A forward yield of 5.13% is attractive for a low‑beta staple, but the 110% payout ratio raises sustainability questions if growth stays negative. Offsetting this, operating cash flow at 3.59T and levered free cash flow at 1.38T provide a buffer. Management could prioritize ordinary dividends and calibrate any extras to cash generation. The June 16, 2025 ex‑date underscores a predictable payout cadence, which may continue to anchor valuation. The market is likely to reward credible signals that payout coverage will trend back toward cash earnings, especially if working capital normalizes. Conversely, any indication of a dividend cut or a prolonged stretch of subpar earnings would challenge the income‑support narrative and widen the equity risk premium.
On operations, margins are still respectable (operating margin 14.63%; profit margin 8.91%), highlighting cost control and scale. Yet quarterly revenue growth at −2.5% YoY and quarterly earnings growth at −9.8% YoY suggest ongoing demand or competitive pressures. For a broad FMCG portfolio, the path back to growth likely runs through mix premiumization, innovation in core categories, and disciplined trade spending. With high insider ownership (85%), strategic alignment appears strong; however, the current ratio of 0.50 argues for cautious balance‑sheet management as the company navigates inventory cycles and receivables. If input cost volatility eases and pricing holds, margins could inch higher even before volumes recover. But if competitive intensity forces promotional activity, margin defense may limit earnings growth, reinforcing the need for top‑line momentum.
The short‑interest update on the OTC line (UNLRY) adds a sentiment wrinkle but should be read with caution given differences in liquidity versus the IDX listing. Still, it signals that a cohort of investors is hedging or expressing skepticism about near‑term upside. For long‑only holders, this is a reminder that catalysts will need to be fundamental: stabilization in quarterly revenue trends, evidence of brand pricing power, and clear capital‑allocation guidance. A confirming sequence—steady volumes, maintained mid‑teens operating margins, and reaffirmed dividends—could reset expectations. Absent that, the shares may drift, with downside buffered by low beta and brand durability but capped by growth doubts. Over a three‑year horizon, the balance of probabilities favors gradual improvement, provided management translates cash‑flow strength into sustainable growth and payout coverage.
What could happen in three years? (horizon September 2025+3)
| Scenario | Outcome by September 2028 |
|---|---|
| Best | Top‑line reaccelerates as innovation and premiumization lift category shares; operating margin sustained in the mid‑teens with improved cash conversion. Dividend maintained with healthier coverage as free cash flow trends higher. Share price rerates on confidence in durable growth and income. |
| Base | Sales growth normalizes at low single‑digits with steady mid‑teens operating margin. Dividend policy remains intact but tightly managed to cash generation. Valuation stabilizes; returns come chiefly from dividends and modest multiple expansion. |
| Worse | Prolonged volume softness and heavier promotions compress margins below recent levels. Dividend is constrained or recalibrated to protect balance‑sheet flexibility. Share price underperforms as investors wait for clearer recovery signals. |
Projected scenarios are based on current trends and may vary based on market conditions.
Factors most likely to influence the share price
- Revenue trajectory: evidence of stabilization or reacceleration versus the current −2.5% YoY quarterly decline.
- Margin discipline: ability to hold operating margin near mid‑teens amid input costs and competitive pricing.
- Dividend coverage: sustaining a 5.13% forward yield while reducing the 110% payout ratio toward cash earnings.
- Cash flow and working capital: consistency of operating cash flow (3.59T) and FCF (1.38T) through seasonal cycles.
- Market sentiment and liquidity: reaction to short‑interest updates, trading volumes (avg 30.06M), and insider/institutional activity.
- Strategic execution: innovation cadence, channel mix, and brand investment impacting share gains across categories.
Conclusion
Unilever Indonesia enters the next three years with resilient cash generation, solid mid‑teens operating efficiency, and a shareholder‑friendly dividend, set against a backdrop of softer near‑term growth. The stock’s low beta and strong brand portfolio make it a natural defensive holding, but the −22.40% 52‑week performance shows that fundamentals still matter: quarterly revenue and earnings need to turn upward to unlock a sustained rerating. Our base case envisions gradual stabilization—low single‑digit sales growth and maintained margins—supporting a steady, better‑covered dividend. Upside rests on successful premiumization and innovation that reignite volumes without sacrificing profitability. Downside centers on margin compression from competitive intensity and any adjustment to payouts. For investors with a three‑year horizon, we think the risk‑reward is balanced to slightly favorable, with dividends providing most of the return while the company works to restore growth momentum.
This article is not investment advice. Investing in stocks carries risks and you should conduct your own research before making any financial decisions.


