


Unilever Indonesia (UNVR.JK) enters the next three years from a position of mixed signals. Trailing twelve‑month revenue stands at 34.3T with net income of 3.06T, translating to an 8.91% profit margin and 14.63% operating margin. Year‑on‑year trends are softer, with quarterly revenue growth at -2.50% and quarterly earnings growth at -9.80%. The share price has been volatile: it touched a 52‑week low of 985 and rebounded toward 1,770 in late July, yet the 52‑week change remains -25.85%; the 50‑day and 200‑day moving averages cluster near 1,585–1,593. Balance sheet and cash‑flow metrics are resilient but tight in places—2T in cash versus 1.94T in debt, a current ratio of 0.50, and 1.38T in levered free cash flow. The forward dividend yield is 5.03% on a 110.00% payout ratio, underscoring a key debate for income investors.
Key Points as of August 2025
- Revenue: TTM revenue 34.3T; gross profit 16.01T; EBITDA 4.84T; revenue per share 899.06.
- Profit/Margins: Net income 3.06T; profit margin 8.91%; operating margin 14.63%; ROE 112.68%; ROA 13.50%.
- Sales/Backlog: Quarterly revenue growth (yoy) -2.50%; quarterly earnings growth (yoy) -9.80%; operating cash flow 3.59T; levered FCF 1.38T.
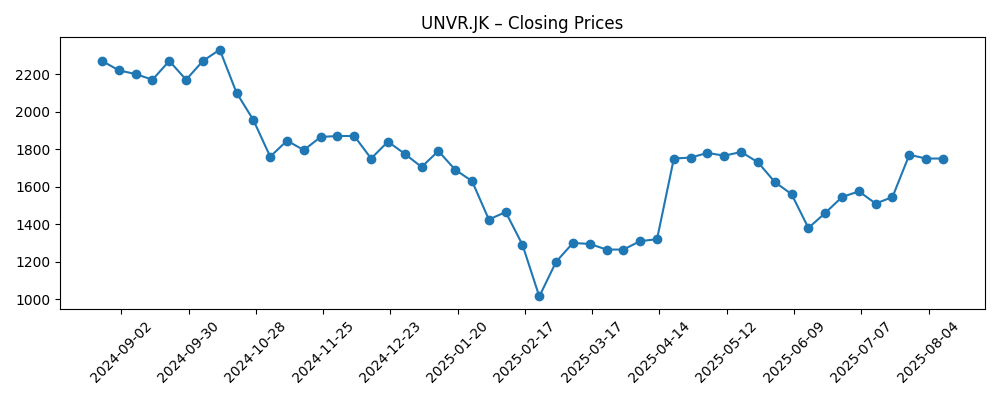
- Share price: 52‑week high 2,440 and low 985; 52‑week change -25.85%; recent weekly close 1,750 (2025‑08‑10); 50‑day MA 1,584.90; 200‑day MA 1,592.78; beta 0.05.
- Dividend: Forward annual rate 88 with forward yield 5.03%; payout ratio 110.00%; trailing rate 47 and yield 2.57%; ex‑dividend date 6/16/2025.
- Balance sheet: Total cash 2T; total debt 1.94T; debt/equity 75.46%; current ratio 0.50.
- Ownership & liquidity: Shares outstanding 38.15B; float 5.73B; insiders hold 85.00%; institutions 3.80%; average 3‑month volume 32.66M (10‑day 38.86M).
- Market cap: Not provided in the supplied data; limited free float may amplify price moves relative to fundamentals.
Share price evolution – last 12 months
Notable headlines
Opinion
The share price trajectory in 2025 highlights a tug‑of‑war between sentiment and fundamentals. After sliding sharply into late February and printing a 52‑week low at 985, the stock recovered into late July around 1,770 before consolidating near 1,750 by August 10. The 50‑day and 200‑day moving averages are tightly grouped around 1,585–1,593, a setup that often precedes larger directional moves as investors reassess the earnings path. Despite a low 5‑year beta of 0.05, recent price swings and rising near‑term volumes suggest idiosyncratic factors are at play. With the 52‑week change at -25.85%, longer‑horizon investors may see room for mean reversion if operational trends stabilize, while shorter‑term traders may focus on whether the price can hold above long‑term averages during periods of risk‑off flows.
Under the surface, profitability remains respectable: an 8.91% profit margin and 14.63% operating margin on 34.3T of revenue, supported by 3.59T in operating cash flow and 1.38T in levered free cash flow. However, liquidity and capital allocation are focal points. A current ratio of 0.50 implies tight working‑capital management, while total cash of 2T and total debt of 1.94T keep leverage in view. The forward dividend yield of 5.03% is attractive, but a 110.00% payout ratio raises sustainability questions if revenue softness persists (quarterly revenue growth at -2.50% and quarterly earnings growth at -9.80%). Income‑oriented holders will likely monitor cash conversion and any signaling from the next ex‑dividend cadence to gauge whether the board prioritizes stability of payouts or flexibility for reinvestment.
Ownership structure can magnify moves. Insiders hold 85.00% and the float is 5.73B, which can tighten liquidity, especially around event windows. That backdrop intersects with July’s headline noting a sharp rise in short interest in the OTC‑traded line (UNLRY). While the ADR and local line are distinct venues, sentiment often travels across listings. Elevated short interest can cut both ways: it may reflect skepticism about near‑term growth, yet it can also create conditions for rapid reversals when news surprises or liquidity thins. Given average 3‑month volume of 32.66M (10‑day 38.86M), swings can be accentuated without large fundamental changes, reinforcing the case for disciplined position sizing while awaiting clearer evidence on the revenue trajectory and margin durability.
Looking three years out, the base path hinges on stabilizing top‑line trends, preserving mid‑teens operating margins, and maintaining strong cash conversion. Execution would likely rely on disciplined pricing, mix, and innovation to offset category and channel pressures. If management prioritizes balance‑sheet prudence, the dividend could be held flat or modestly reshaped to align payouts with cash generation, reducing reliance on balance‑sheet flexibility. In a stronger case, demand normalizes, the brand portfolio gains share, and operating efficiencies support incremental margin improvement, allowing cash returns and selective investment. In a weaker case, competitive intensity and input‑cost friction keep growth subdued, straining payout capacity and sentiment. With moving averages clustered and the 52‑week range wide, the setup favors a data‑driven approach—watching sales momentum, pricing elasticity, and cost discipline as the main guides.
What could happen in three years? (horizon August 2025+3)
| Scenario | Narrative | Implied outcomes |
|---|---|---|
| Best case | Demand stabilizes and gradually improves; brand investments and execution support steady growth while cost controls hold. | Margins remain healthy; cash generation comfortably covers dividends; sentiment improves and the share price sustains above long‑term trends. |
| Base case | Top‑line trends normalize but remain mixed; pricing and mix offset pressures; balance sheet stays disciplined. | Dividend policy aligns with cash flow, potentially flatter; valuation reflects a defensive, income‑oriented profile with measured volatility. |
| Worse case | Persistent revenue softness and category competition weigh on operating leverage; cost inflation proves sticky. | Payout flexibility becomes a focus; investor sentiment turns cautious and the stock trades closer to the lower end of recent ranges. |
Projected scenarios are based on current trends and may vary based on market conditions.
Factors most likely to influence the share price
- Trajectory of sales and earnings after recent year‑on‑year declines in revenue and earnings growth.
- Dividend policy versus cash generation, given the 110.00% payout ratio and timing of future distributions.
- Input‑cost and pricing dynamics that affect margins and working‑capital needs amid a 0.50 current ratio.
- Ownership structure and liquidity (85.00% insider holdings, limited float) interacting with changes in short interest and trading volumes.
- Balance‑sheet flexibility (2T cash, 1.94T debt) and any strategic actions affecting leverage or capital allocation.
Conclusion
Unilever Indonesia’s set‑up into 2028 is balanced between resilient profitability and the need to re‑accelerate growth. The company’s 8.91% profit margin and 14.63% operating margin on 34.3T in revenue demonstrate durable earnings power, and cash generation (3.59T operating, 1.38T levered FCF) provides a foundation for reinvestment and shareholder returns. Yet soft year‑on‑year revenue and earnings trends, a tight 0.50 current ratio, and the 110.00% payout ratio argue for a cautious stance on the dividend’s growth path. The stock’s rebound from the 52‑week low to late‑July levels, coupled with tightly grouped moving averages, suggests a pivotal period ahead: clearer sales traction could unlock a sustained rerating, while prolonged softness would likely anchor the shares within recent ranges. Over a three‑year horizon, disciplined execution, calibrated payouts, and steady cash conversion are the levers most likely to support a constructive, if measured, recovery.
This article is not investment advice. Investing in stocks carries risks and you should conduct your own research before making any financial decisions.


