


As of August 2025, Takeda Pharmaceutical (4502.T) presents a mixed picture: solid cash generation and a high, income‑oriented dividend offset by slowing top‑line momentum and a sizeable debt load. Trailing 12‑month revenue is ¥4.48T with operating margin of 16.89% and net margin of 3.06%, while quarterly revenue growth is –8.4% year over year even as quarterly earnings growth improved 30.4%. Shares have been range‑bound within the ¥3,916–¥4,593 band over the past year, recently closing near ¥4,390, with a low beta of 0.27 and a forward dividend yield of 4.54% (¥200 per share; ex‑div 29 Sep 2025). Leverage remains notable (total debt ¥5.04T) but is supported by operating cash flow of ¥1.1T and levered free cash flow of ¥718.93B. Over the next three years, investor focus is likely to center on margin resilience, dividend sustainability, and any tangible R&D or portfolio catalysts.
Key Points as of August 2025
- Revenue: Trailing 12‑month revenue ¥4.48T; quarterly revenue growth –8.4% year over year.
- Profit/Margins: Operating margin 16.89%; net margin 3.06%; EBITDA ¥1.22T; gross profit ¥2.91T.
- Earnings Quality: Diluted EPS 85.40; net income attributable to common ¥136.92B; ROE 1.87%, ROA 2.31%.
- Cash Flow & Leverage: Operating cash flow ¥1.1T; levered free cash flow ¥718.93B; total debt ¥5.04T; current ratio 1.16; debt/equity 73.42%.
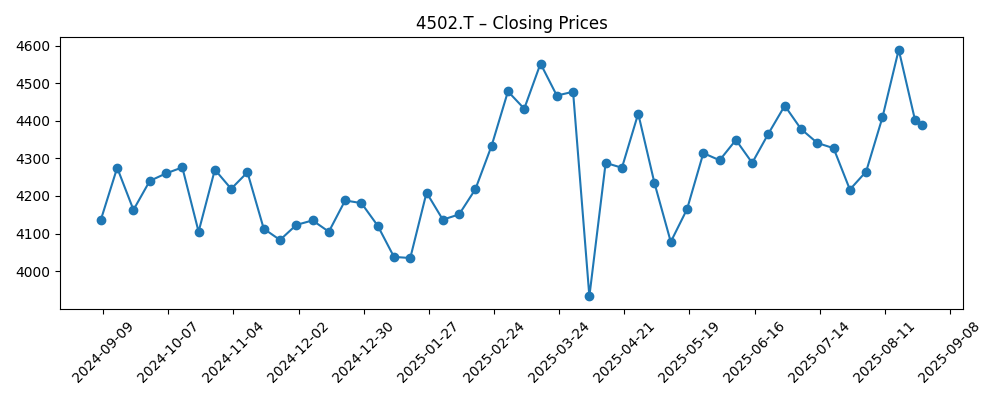
- Share Price: 52‑week range ¥3,916–¥4,593; recent close ~¥4,390; 50‑DMA ¥4,362 and 200‑DMA ¥4,260.84; beta 0.27.
- Dividend: Forward dividend ¥200 (4.54% yield); trailing ¥196 (4.45%); payout ratio 229.19%; ex‑dividend 29 Sep 2025; 5‑year average yield 4.64%.
- Ownership & Liquidity: Institutions hold 43.57%; float ~1.56B shares; 3‑month average volume 4.03M, 10‑day average 4.55M.
- Market Cap: Approximately ¥6.94T (based on ~1.58B shares outstanding and ~¥4,390 share price).
- Sales/Backlog Proxy: Quarterly earnings growth +30.4% yoy despite revenue decline, indicating cost discipline and mix effects.
Share price evolution – last 12 months
Notable headlines
Opinion
Takeda’s share price has spent much of the last six months oscillating between roughly ¥4,060 in January and a mid‑August uptick near ¥4,589, before easing back toward the ¥4,390 area. That pattern, together with a beta of 0.27 and supportive 50‑ and 200‑day moving averages (¥4,362 and ¥4,260.84), points to a defensive equity that investors treat as an income vehicle rather than a growth proxy. The forward dividend yield of 4.54% and a five‑year average yield of 4.64% reinforce that view. However, the payout ratio of 229.19% is elevated, which will keep dividend sustainability under scrutiny unless earnings and free cash flow continue to bridge the gap. In the absence of clear, company‑specific headline catalysts in recent months, the stock’s path has been dictated by fundamentals: margins, cash conversion, and leverage management.
From here, three levers matter most over a three‑year horizon. First, revenue stabilization after a –8.4% year‑over‑year quarterly decline is essential; without it, even disciplined cost control may not prevent compression in the net margin, currently 3.06%. Second, preserving operating margin around 16.89% will likely hinge on product mix, manufacturing efficiency, and SG&A discipline—factors that supported a 30.4% improvement in quarterly earnings growth despite the top‑line dip. Third, the balance sheet: total debt of ¥5.04T is manageable only if operating cash flow (¥1.1T ttm) and levered free cash flow (¥718.93B ttm) remain resilient. Refinancing conditions and interest costs could swing equity value, especially if macro rates stay higher for longer.
Income‑oriented holders may tolerate modest earnings volatility so long as cash generation underpins the dividend. The current ratio of 1.16 and cash of ¥350.01B provide liquidity, but rising working‑capital needs or delayed receipts could pinch. With revenue per share at ¥2,839.50 and book value per share at ¥4,395.19, valuation support exists if profitability holds, but return on equity (1.87%) is low for a mature global pharma, which limits multiple expansion without a clearer growth vector. In practical terms, that tilts the risk‑reward toward carry and capital preservation rather than aggressive capital gains, unless Takeda can surface new high‑margin assets, improve geographic mix, or extract further efficiencies.
In a base‑case trajectory, shares may continue to trade around longer‑term averages while investors clip the coupon and wait for inflection. A better‑than‑expected path would feature revenue stabilization, sustained mid‑teens operating margins, and incremental deleveraging—conditions that could nudge the stock toward the upper end of its observed range and potentially re‑rate if return on equity improves. Conversely, a weaker path would see prolonged revenue pressure, margin squeeze, and tighter dividend coverage, inviting a focus on balance‑sheet conservatism. With institutions holding 43.57% and liquidity supported by ~4–5M shares trading daily, market technicals should remain orderly; catalysts, not flows, are likely to set direction.
What could happen in three years? (horizon August 2025+3)
| Scenario | Assumptions | Implications by 2028 |
|---|---|---|
| Best | Revenue stabilizes after recent –8.4% yoy quarter; operating margin sustained near current 16.89% or modestly higher; steady operating cash flow around recent levels; disciplined capex and SG&A. | Dividend maintained with healthier coverage; gradual deleveraging from ¥5.04T; shares trend toward the upper end of recent ¥3,916–¥4,593 range with potential re‑rating as ROE lifts from 1.87%. |
| Base | Flat to modestly negative revenue growth; margin intact but not expanding; cash flow adequate to service debt; payout policy unchanged. | Share price tracks moving averages (¥4,260–¥4,360) and yield anchors returns; limited multiple expansion absent new catalysts; balance sheet broadly steady. |
| Worse | Persistent top‑line pressure and mix headwinds; operating margin drifts below current level; refinancing costs rise; cash generation weakens. | Dividend coverage tightens, prompting cautious guidance; leverage concerns resurface; shares gravitate toward the lower end of the ¥3,916–¥4,593 band as investors de‑risk. |
Projected scenarios are based on current trends and may vary based on market conditions.
Factors most likely to influence the share price
- Pipeline and regulatory outcomes that affect revenue trajectory after a –8.4% yoy quarterly decline.
- Margin discipline versus inflation and pricing pressure, given 16.89% operating margin and 3.06% net margin.
- Balance‑sheet management and refinancing terms relative to ¥5.04T total debt and ¥1.1T operating cash flow.
- Dividend policy and coverage, with a 4.54% forward yield and 229.19% payout ratio.
- Foreign‑exchange and reimbursement dynamics impacting international sales and cash conversion.
- Market risk appetite; low beta (0.27) can dull upside in risk‑on phases but support in risk‑off periods.
Conclusion
Takeda enters the next three years as a defensive, income‑tilted holding with identifiable levers. The balance of evidence—low beta, a 4.54% forward yield, and steady cash generation—argues for stability rather than breakout growth, especially while quarterly revenue growth remains negative (–8.4% yoy) and ROE sits at 1.87%. That said, the company’s margin profile (16.89% operating) and ¥1.1T of operating cash flow provide room to navigate debt obligations and sustain investment. For equity holders, the watch‑list is clear: confirm revenue stabilization, protect margins, and strengthen dividend coverage. If those boxes are ticked, a slow grind higher toward the top of the ¥3,916–¥4,593 one‑year range is plausible over time, alongside modest deleveraging. If not, the stock likely remains anchored near moving averages with return dominated by yield. Position sizing should reflect that balance of income support and growth uncertainty.
This article is not investment advice. Investing in stocks carries risks and you should conduct your own research before making any financial decisions.


