


Suntory Beverage & Food Limited (2587.T) enters late‑2025 with resilient cash generation but soft top‑line momentum. Trailing‑twelve‑month revenue stands at ¥1.69T and quarterly revenue growth is −1.10% year on year, while profitability metrics remain solid (operating margin 10.14%, profit margin 5.23%). The balance sheet is conservatively positioned, with cash exceeding debt and a current ratio of 1.23, supporting a forward dividend yield of 2.56% at a payout ratio of 43.82%. Shares trade around ¥4,698, down 14.34% over the past 52 weeks versus the S&P 500’s +16.54%, leaving sentiment restrained. With operating cash flow of ¥189.14B and levered free cash flow of ¥74.56B, management has room to defend margins and shareholder returns. This note outlines a three‑year outlook based on recent trends, risks, and catalysts.
Key Points as of September 2025
- Revenue: ¥1.69T (ttm); quarterly revenue growth −1.10% yoy; gross profit ¥642.45B.
- Profitability: operating margin 10.14%; profit margin 5.23%; EBITDA ¥223.25B; net income ¥88.14B; ROE 8.37%.
- Sales/Backlog: revenue per share ¥5,455.72; no formal backlog disclosed; −2.00% quarterly earnings growth indicates near‑term softness.
- Balance sheet: cash ¥145.88B vs debt ¥48.18B; current ratio 1.23; operating cash flow ¥189.14B; levered FCF ¥74.56B.
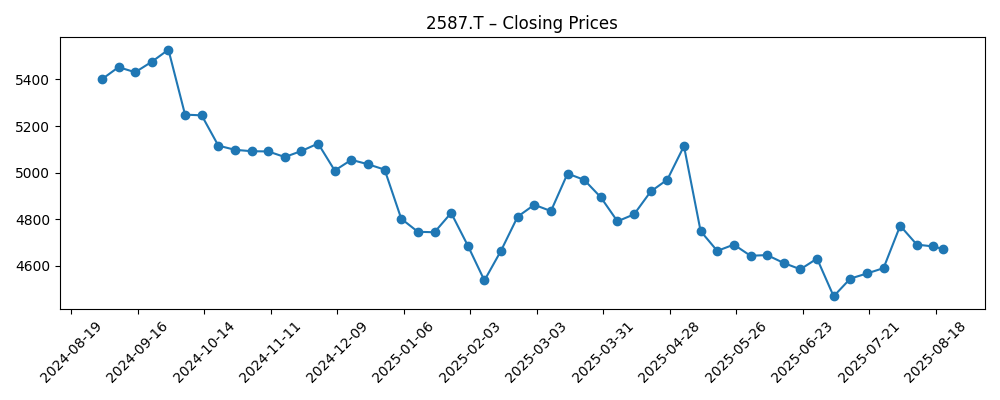
- Share price: ¥4,698 (22 Sep 2025); 52‑week change −14.34%; range ¥4,442–¥5,602; 50‑day MA ¥4,615.34; 200‑day MA ¥4,761.10.
- Ownership/liquidity: insiders 59.70%, institutions 21.12%; float 125.2M; 3‑month avg volume 850.07k; beta 0.00.
- Analyst/market tone: no clear rating shift; underperformance vs S&P 500 (+16.54%) suggests cautious sentiment.
- Market cap: roughly ¥1.45T (¥4,698 × 309M shares outstanding).
Share price evolution – last 12 months
Notable headlines
Opinion
Shares have trended lower over the past year, with the price at ¥4,698 and a 52‑week change of −14.34%, reflecting modest revenue contraction (−1.10% yoy in the latest quarter) and slightly negative earnings momentum (−2.00% yoy). Despite this, operating fundamentals appear durable: a 10.14% operating margin, 5.23% profit margin, and positive free cash flow provide ballast. Heavy insider ownership (59.70%) implies a long‑term orientation and can reduce float‑driven volatility, while a beta of 0.00 in the dataset suggests historically low correlation to broader markets. In our view, the market is discounting growth ambiguity more than balance‑sheet risk. With cash exceeding debt and a 1.23 current ratio, downside should be cushioned by liquidity and the ability to sustain investment in brands and distribution without stressing leverage.
The dividend profile is a central pillar of the equity story. A forward yield of 2.56% and a 43.82% payout ratio look maintainable against ¥189.14B in operating cash flow and ¥74.56B in levered free cash flow. This gives management flexibility to fund selective marketing, capacity, and productivity initiatives while continuing shareholder returns. If input‑cost pressures stabilize and pricing discipline holds, mid‑cycle margins could be defended even with subdued volume growth. Conversely, a prolonged demand slowdown would likely shift focus toward cost control and mix management to protect profitability, with dividends acting as a bridge for total return while topline recovers.
Technical context is mixed but not alarming. The stock sits below its 200‑day moving average (¥4,761.10) yet near the 50‑day average (¥4,615.34), suggesting consolidation rather than capitulation. The 52‑week range of ¥4,442–¥5,602 frames risk and potential rebound if execution and sentiment improve into year‑end. Average volumes (around 850k shares over three months) indicate adequate liquidity for most investors, though the sizable insider stake and float of 125.2M shares can amplify moves around catalysts such as results, dividends (ex‑date currently 29 Dec 2025), or portfolio actions. Until growth re‑accelerates, the path of least resistance is gradual mean‑reversion tied to cash flow delivery.
Over a three‑year horizon, we see three levers determining returns: revenue stabilization, margin resilience, and capital allocation. If management can convert operational efficiency into sustained free cash flow while avoiding balance‑sheet stretch, the equity case remains intact even without aggressive growth. Relative underperformance versus the S&P 500 (+16.54% vs −14.34%) may set a lower expectations bar; any uptick in demand, disciplined pricing, or cost normalization could drive a re‑rating. Alternatively, a tougher macro or category‑specific headwinds could keep the shares range‑bound, with dividends doing most of the work. Execution, not financial capacity, looks like the swing factor from here.
What could happen in three years? (horizon September 2028)
| Scenario | Revenue/Margins | Capital Allocation | Share Price Setup |
|---|---|---|---|
| Best | Demand normalizes with steady pricing; margins hold or improve on cost discipline and mix. | Dividend maintained with potential incremental returns supported by consistent free cash flow. | Re‑rating toward historical averages as execution credibility improves and sentiment turns constructive. |
| Base | Modest growth with stable margins; efficiency offsets uneven volumes. | Dividend sustained at current policy; investment focused on productivity and select growth initiatives. | Range‑bound performance tracking cash flow delivery and macro signals. |
| Worse | Prolonged volume softness and input‑cost pressure compress margins. | Capital preservation becomes priority; dividend maintained but growth limited. | De‑rating persists until trends stabilize and cost actions rebuild confidence. |
Projected scenarios are based on current trends and may vary based on market conditions.
Factors most likely to influence the share price
- Input costs and supply chain (packaging, energy, sweeteners) impacting gross margin trajectory.
- Currency volatility affecting reported results and competitiveness in key export/overseas markets.
- Category demand and pricing dynamics amid shifting consumer preferences and retail promotions.
- Capital allocation discipline – stability of the dividend and prioritization of organic investment.
- Regulatory and tax changes (e.g., sugar levies, labeling) that could alter pricing and mix.
- Liquidity and ownership structure (59.70% insiders, 125.2M float) influencing trading behavior around catalysts.
Conclusion
Suntory Beverage & Food’s investment case into 2028 is anchored by resilient cash generation, conservative leverage, and a defendable dividend. While near‑term fundamentals point to subdued growth (−1.10% quarterly revenue and −2.00% earnings yoy), the company’s 10.14% operating margin, positive free cash flow, and cash exceeding debt provide levers to navigate a softer demand backdrop. Share performance has lagged (−14.34% over 52 weeks), but technicals suggest consolidation rather than structural impairment, and expectations appear reset. Upside over three years hinges on modest revenue stabilization, cost discipline, and steady capital returns; downside centers on sustained input‑cost pressure or demand weakness that erodes margins. With a forward yield of 2.56% and a 43.82% payout ratio backed by ¥189.14B in operating cash flow, total return can still be competitive if execution holds. For long‑term investors, risk‑reward skews to operational delivery rather than balance‑sheet capacity.
This article is not investment advice. Investing in stocks carries risks and you should conduct your own research before making any financial decisions.


