


Meituan-W (3690.HK) enters September 2025 after a difficult stretch for the share price, which finished the latest week at 100.60, down 41.51% over 12 months and near the 52-week low of 95.350. Fundamentals are mixed: trailing revenue is 360.46B with gross profit of 133.03B and net income of 29.51B, yet operating margin (ttm) is -2.41% and quarterly earnings growth fell 96.80% year over year. Liquidity remains a strength, with 171.02B in cash against 50.98B of debt and a current ratio of 1.93, supporting continued investment in local services and adjacent initiatives. Technically, the stock sits below its 50-day (113.944) and 200-day (138.876) moving averages, while a 0.19 beta suggests low market correlation. With no dividend and 5.53B shares outstanding, the three-year outlook hinges on execution, monetization quality, and margin stabilization.
Key Points as of September 2025
- Revenue (ttm): 360.46B; revenue per share: 59.50; quarterly revenue growth (yoy): 11.70%.
- Profit/margins: profit margin 8.19%; operating margin (ttm) -2.41%; ROE 17.12%; ROA 5.19%.
- Cash/Balance sheet: total cash 171.02B; total debt 50.98B; current ratio 1.93; total debt/equity 27.66%; operating cash flow 47.01B; levered free cash flow 23.44B.
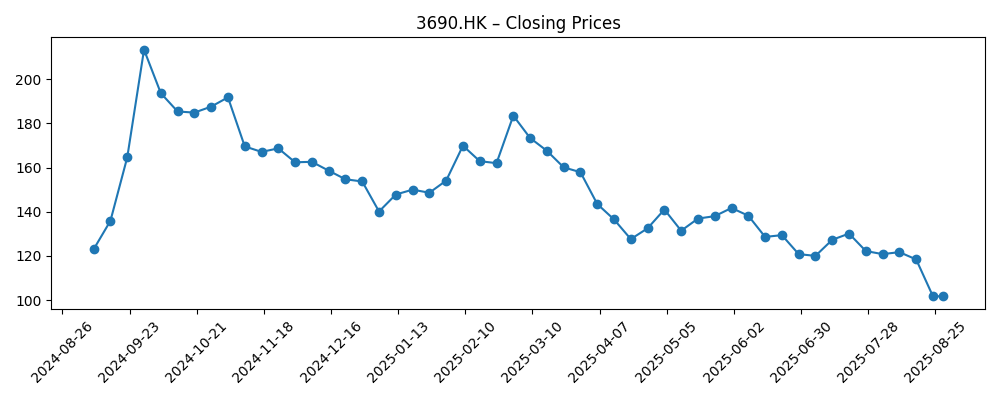
- Share price & trading: last weekly close 100.60; 52-week high 217.000; 52-week low 95.350; 52-week change -41.51%.
- Trend & risk: below 50-day MA 113.944 and 200-day MA 138.876; beta (5Y) 0.19; liquidity: avg vol (3m) 69.67M; avg vol (10d) 76.36M.
- Earnings momentum: diluted EPS (ttm) 5.110; net income to common (ttm) 29.51B; quarterly earnings growth (yoy) -96.80%.
- Ownership: shares outstanding 5.53B; implied shares outstanding 6.11B; float 5.38B; institutions hold 37.93%; insiders hold 1.87%.
- Capital returns: no dividend; trailing annual dividend yield 0.00%; payout ratio 0.00%.
- Market cap context: large-cap profile signaled by 5.53B–6.11B shares; snapshot does not provide market capitalization.
Share price evolution – last 12 months
Notable headlines
Opinion
The share price reset through mid-2025 reflects a tug-of-war between solid top-line expansion and pressure on profitability. Trailing revenue growth at 11.70% year over year shows the local-services engine is still attracting users and merchants, yet the negative operating margin (ttm) and a sharp drop in quarterly earnings growth signal mix and investment headwinds. With the stock trading below both the 50-day and 200-day moving averages, sentiment is cautious. Over a three-year horizon, the path to a healthier margin structure will likely matter more than absolute order volume. Investors will watch whether the company can improve take rates and advertising monetization while dialing back subsidies in a way that preserves user frequency and merchant satisfaction.
Balance sheet strength offers a cushion. Total cash of 171.02B versus 50.98B of debt and a 1.93 current ratio allow continued product, logistics, and merchant-tool investment without stressing liquidity. Operating cash flow of 47.01B and levered free cash flow of 23.44B indicate the model can fund growth initiatives internally. That flexibility is valuable amid intense competition across on-demand delivery, in-store services, and local ads. It buys time to iterate on assortment, service levels, and merchant productivity tools that can lift unit economics, even as the company navigates mixed consumer confidence and a still-evolving regulatory backdrop.
Execution on cost discipline is the swing factor. The contrast between an 8.19% profit margin and a -2.41% operating margin (ttm) suggests non-operating items or segment mix are cushioning bottom-line figures while core operations absorb reinvestment. Over the next three years, narrowing that gap via route density gains, better incentive design, and higher-margin services (e.g., advertising, SaaS-like merchant solutions) could steadily push operating results toward consistency. Conversely, if competitive pricing, promotions, or new vertical investments expand losses, headline growth may not translate into durable earnings or cash generation—prolonging the multiple compression seen in the past year.
From a market-structure perspective, the low beta (0.19) indicates company-specific outcomes may dominate returns rather than broad index moves. With no dividend and sizeable share count, equity upside will likely depend on visible improvements in operating metrics and confidence that quarterly earnings volatility is receding. Clear disclosures around investment cadence, monetization levers, and payback periods would help reset expectations. If management can demonstrate that current spending is translating into higher-quality revenue, the shares could re-rate from levels near the 52-week low. If not, the stock may remain range-bound as investors seek evidence of durable profit expansion.
What could happen in three years? (horizon September 2028)
| Scenario | Revenue path | Margins | Balance sheet & cash | Key drivers |
|---|---|---|---|---|
| Best | Growth accelerates from the recent 11.70% yoy pace as local services deepen and merchant ads scale. | Operating performance turns sustainably positive, narrowing the gap to the profit margin. | Strong cash generation supports reinvestment while keeping leverage modest. | Improved take rates, higher ad penetration, route density, and disciplined subsidies. |
| Base | Growth holds near recent levels, with steady user and merchant engagement. | Gradual margin improvement toward breakeven as efficiency programs compound. | Cash remains comfortably above debt; internal cash flow funds core initiatives. | Stable competitive intensity; incremental monetization in in-store and advertising. |
| Worse | Growth slows amid weaker demand and heavier competition in delivery and local ads. | Operating margin stays negative; earnings remain volatile. | Cash cushions near-term needs, but investment pace moderates to protect liquidity. | Promotion-heavy rivalry, regulatory hurdles, and slower merchant adoption. |
Projected scenarios are based on current trends and may vary based on market conditions.
Factors most likely to influence the share price
- Profit and margin trajectory: ability to lift operating performance from -2.41% (ttm) toward consistency.
- Competitive dynamics across food delivery, local services, and advertising from established and emerging platforms.
- Consumer demand and policy backdrop affecting discretionary spending and merchant activity in core cities.
- Execution on cost discipline, logistics efficiency, and subsidy management to protect unit economics.
- Share base and capital actions: shares outstanding (5.53B) vs implied shares (6.11B) and any dilution or lack thereof.
- Market sentiment toward China internet equities, reflected in trading below the 50-day and 200-day moving averages.
Conclusion
Meituan-W’s three-year setup is a classic execution story. The company combines a large and engaged ecosystem with scale economics and ample liquidity—171.02B in cash versus 50.98B in debt—yet the market is focused on converting growth into dependable operating profits. Recent data show healthy revenue momentum (11.70% yoy) but sharp earnings volatility and a negative operating margin, which, together with technical weakness, have pulled the shares toward 52-week lows. If management delivers steady margin repair, improves monetization quality (including higher-value advertising and merchant services), and sustains positive free cash flow, sentiment could normalize from depressed levels. In the absence of a dividend, consistent execution is the catalyst. Conversely, if competition forces heavier subsidies or macro softness lingers, valuation may remain constrained. On balance, the base case favors gradual, capability-driven improvement rather than abrupt recovery, with the balance sheet providing time to execute.
This article is not investment advice. Investing in stocks carries risks and you should conduct your own research before making any financial decisions.


