
MediaTek (2454.TW) enters September 2025 with improving fundamentals and a solid balance sheet. Trailing‑twelve‑month revenue stands at 573.54B with net income of 106.31B, translating to a 18.54% profit margin and 19.54% operating margin. Cash of 196.74B far exceeds total debt of 15.26B, while operating cash flow of 140B underpins investment and dividends (forward dividend rate 54; 3.94% yield; payout ratio 80.96%). Shares have risen 11.84% over the past year, below the S&P 500’s 16.84%, trading between a 52‑week low of 1,080 and high of 1,575; the 50‑day and 200‑day averages sit at 1,355.70 and 1,381.20. With quarterly revenue growth of 18.10% year over year and earnings up 8.30%, the three‑year outlook hinges on Android demand, on‑device AI adoption, and competitive dynamics in 5G and edge computing.
Key Points as of September 2025
- Revenue: 573.54B (ttm); quarterly revenue growth 18.10% yoy indicates recovering Android demand and mix shift to higher‑end SoCs.
- Profit/Margins: Profit margin 18.54%; operating margin 19.54%; gross profit 279.04B; EBITDA 125.31B.
- Sales/Backlog: Backlog not disclosed; momentum implied by positive yoy revenue and earnings growth (8.30%).
- Share price: Up 11.84% over 52 weeks, within 1,080–1,575 range; 50‑day/200‑day averages at 1,355.70/1,381.20; beta 0.96.
- Balance sheet: Total cash 196.74B vs total debt 15.26B; current ratio 1.35; debt/equity 3.97% supports resilience.
- Capital returns: Forward dividend rate 54 (3.94% yield); payout ratio 80.96%—supportive but limits flexibility if earnings soften.
- Ownership/liquidity: Shares outstanding 1.6B; float 1.42B; average 3‑month volume 6.51M; 10‑day 4.62M.
- Market cap: Implied by recent price multiplied by 1.6B shares outstanding; large‑cap profile.
- Analyst/investor focus: On‑device AI attach rates, premium Android share, 5G refresh cycle, and tariff/supply‑chain headwinds.
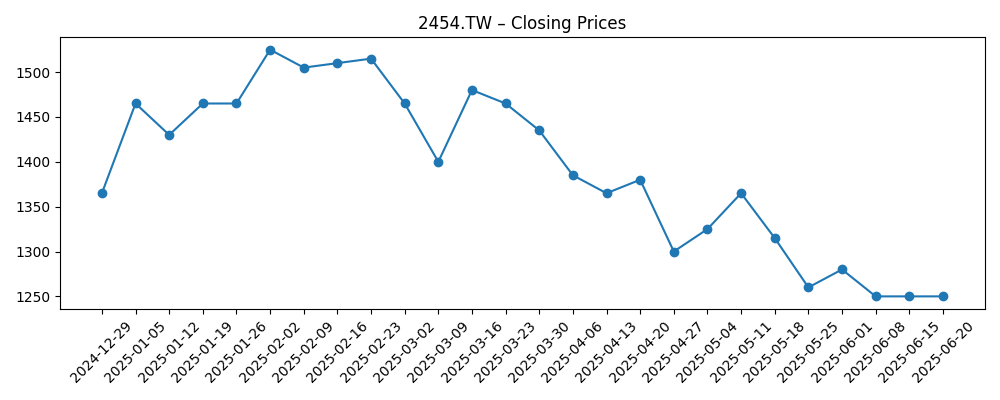
Share price evolution – last 12 months
Notable headlines
Opinion
Over the last six months, MediaTek’s shares traced a cyclical pattern typical of Android‑exposed names: strength into early 2025, a pullback through late spring, and a summer rebound. Weekly closes show a retreat toward the mid‑1,200s in June before recovering above 1,400 in July and settling around the mid‑1,300s by late August. That price path mirrors improving, yet not euphoric, fundamentals: revenue growth of 18.10% year over year with earnings up 8.30% and margins near 20%. The market appears to be weighing two forces—on‑device AI and premium mix lift versus macro and tariff risks. With beta at 0.96 and 50‑/200‑day averages clustered near current levels, technicals suggest a consolidation phase while investors seek confirmation that AI‑capable chipsets can sustain pricing and share gains into the next Android cycle.
Balance sheet strength remains a key support. Cash of 196.74B versus 15.26B of total debt provides optionality to fund R&D, ensure foundry supply, and smooth volatility in handset demand. Operating cash flow of 140B reinforces that capacity. The forward dividend (rate 54; 3.94% yield) offers income support, though the 80.96% payout ratio implies a narrower buffer if gross margins face ASP pressure or if unit volumes disappoint. In our view, management’s capital allocation priority is likely to remain steady dividends while preserving flexibility for node transitions and AI acceleration. That calculus favors stability over aggressive buybacks until visibility on margins and utilization improves.
Strategically, the next leg of value creation hinges on deeper penetration of AI‑capable chipsets across mid‑ and high‑tier Android, plus attach rates in edge devices beyond smartphones. If on‑device AI features (vision, speech, low‑latency inferencing) become must‑have capabilities, MediaTek’s competitive positioning against peers in performance‑per‑watt and integrated connectivity should matter more than raw peak speeds. Success would likely show up first in mix—supporting gross profit—before broadening to units. Conversely, tariff or export frictions could shift OEM roadmaps and inventory behavior, elongating sell‑through cycles and compressing pricing power. Given beta below 1 and improving fundamentals, downside may be buffered, but execution on AI roadmaps remains pivotal.
Looking three years out, a balanced base case is that Android demand normalizes as replacement cycles and AI features stabilize, keeping operating margins around current levels while revenue grows with the category. The upside case would feature faster adoption of AI at the device edge and further share gains in premium Android, enabling margin expansion and a valuation re‑rating. The downside case centers on prolonged tariff pressure, foundry cost inflation, or an aggressive response from competitors that forces price concessions. Across paths, the dividend policy is a stabilizer; however, maintaining today’s payout ratio would likely require continued earnings growth. Monitoring quarterly revenue growth, mix, and cash trends will be the cleanest read‑outs on the trajectory.
What could happen in three years? (horizon September 2028)
| Scenario | Revenue/Margins Trajectory | Strategic Drivers | Shareholder Implications |
|---|---|---|---|
| Best | Faster growth with sustained margin expansion as AI‑capable SoCs drive premium mix. | High attach of on‑device AI across mid/high tiers; strong 5G refresh; stable supply chain. | Potential valuation re‑rating; dividend well covered; capacity for incremental investment. |
| Base | Steady growth with margins broadly stable near recent levels. | Normalized Android cycle; competitive parity; disciplined pricing and costs. | Total return driven by earnings progression and dividends; valuation in line with history. |
| Worse | Softer growth and margin compression from pricing pressure and weaker OEM demand. | Tariff/supply disruptions; intensified competition; slower AI adoption in mid‑range. | De‑rating risk; dividend constrained by payout ratio; focus shifts to balance‑sheet defense. |
Projected scenarios are based on current trends and may vary based on market conditions.
Factors most likely to influence the share price
- Adoption of on‑device AI in Android smartphones and edge devices, affecting mix and pricing power.
- Tariff, export‑control, and supply‑chain dynamics that influence OEM ordering and lead times.
- Competitive intensity in premium and mid‑range SoCs, including performance‑per‑watt and modem integration.
- Foundry costs and node transitions that impact gross margin and product timing.
- Capital allocation discipline given an 80.96% payout ratio and the need to fund R&D.
Conclusion
MediaTek’s three‑year setup blends improving fundamentals with recognizable cyclical and geopolitical risks. Revenue of 573.54B (ttm), rising 18.10% year over year in the latest quarter, and solid profitability (profit margin 18.54%; operating margin 19.54%) provide a sturdy base. The balance sheet—196.74B in cash against 15.26B in debt—adds resilience, while operating cash flow of 140B supports continued investment in AI‑capable platforms and a forward dividend (rate 54; 3.94% yield). The stock’s 52‑week performance (+11.84%) and proximity to key moving averages suggest investors await clearer evidence that on‑device AI can lift mix and margins sustainably into the next Android cycle. If execution aligns with demand for edge AI and supply conditions remain orderly, the path skews constructive; if tariffs or pricing pressures intensify, returns likely revert to dividend carry and balance‑sheet defense. Watch mix, margins, and cash trends for the earliest read‑throughs.
This article is not investment advice. Investing in stocks carries risks and you should conduct your own research before making any financial decisions.