


KPN enters October 2025 with modest top-line momentum and a defensive equity profile. Trailing 12‑month revenue stands at 5.73B with EBITDA of 2.28B and a 14.42% profit margin, while quarterly revenue growth is 5.90% year over year despite softer earnings growth (-8.40%). The balance sheet is geared (total debt 7.15B; debt/equity 207.96%) and liquidity is tight (current ratio 0.72), but operating cash flow of 2.16B underpins a forward dividend of 0.18 per share, a 4.36% yield with an 89.47% payout ratio. Shares have traded between 3.446–4.267 over the past year; recent weekly closes hover near 3.97, with low volatility (beta 0.22). Over the next three years, investor returns are likely to hinge on execution in core connectivity, cost discipline, and capital allocation, including debt reduction and dividend sustainability.
Key Points as of October 2025
- Revenue: 5.73B (ttm); quarterly revenue growth 5.90% YoY; revenue per share 1.48.
- Profit/margins: profit margin 14.42%; operating margin 23.83%; EBITDA 2.28B; net income 776M; diluted EPS 0.19.
- Sales/backlog: no formal backlog disclosure; sales trends steady as evidenced by ongoing revenue growth.
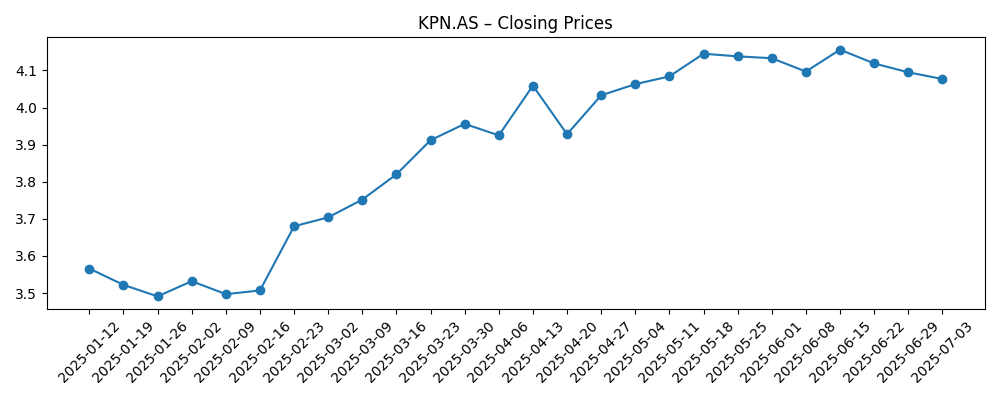
- Share price: last weekly close ~3.971 (2025-10-06); 52‑week range 3.446–4.267; 50‑day MA 4.0599; 200‑day MA 3.9151; beta 0.22.
- Analyst/investor focus: dividend yield 4.36% with an 89.47% payout; institutional ownership 70.50%.
- Market cap: approximately 15.21B based on 3.83B shares outstanding and a ~3.97 share price.
- Cash flow: operating cash flow 2.16B; levered free cash flow 662M.
- Balance sheet: total debt 7.15B; debt/equity 207.96%; current ratio 0.72; cash 374M.
Share price evolution – last 12 months
Notable headlines
- KPN’s emotive new campaign addresses online bullying [Creative Review]
- Critical Review: Koninklijke KPN (OTCMKTS:KKPNF) vs. TELUS (NYSE:TU) [ETF Daily News]
- What’s up with… T-Mobile US, Verizon, KPN [TelecomTV]
Opinion
KPN’s share price has stair-stepped higher through 2025, reaching a 52‑week high at 4.267 before easing back toward the 50‑day average and closing near 3.97 in early October. The combination of a low beta (0.22) and a mid‑single‑digit dividend yield has kept the stock in demand among income‑oriented investors, even as global indices oscillate. With the 200‑day average rising (3.9151), the technical setup suggests downside may be cushioned by yield support and longer‑term buyers, while upside likely requires incremental evidence of earnings reacceleration after the recent -8.40% quarterly earnings growth. Over the next three years, this pattern argues for a “carry and compound” story: modest capital appreciation layered on top of a recurring cash return, provided operations remain stable and capital intensity does not materially rise.
Dividend sustainability is the fulcrum. The indicated forward dividend of 0.18 equates to a 4.36% yield, but the payout ratio sits high at 89.47%. Offsetting this, operating cash flow of 2.16B and levered free cash flow of 662M provide coverage, while net income of 776M helps anchor distributions. The balance sheet is clearly leveraged (7.15B debt; debt/equity 207.96%) and liquidity tight (current ratio 0.72), so management’s capital allocation choices will likely prioritize maintaining the dividend and gradually reducing leverage. If refinancing conditions stay orderly and cost controls protect the 23.83% operating margin, KPN can plausibly sustain, or inch up, the dividend without stressing the balance sheet—though any negative shock to cash generation would narrow that margin for error.
Top‑line progress is encouraging. Trailing revenue of 5.73B with 5.90% quarterly growth signals steady demand, and brand investment—evidenced by initiatives such as the online‑bullying campaign—can bolster customer perception and reduce churn. While such campaigns are not direct revenue drivers, they reinforce trust for essential connectivity services. Over a three‑year horizon, KPN’s path to compounding value likely runs through disciplined pricing, selective upselling, and continued cost efficiency to convert revenue growth into free cash flow. Institutional ownership of 70.50% suggests a patient holder base that typically rewards predictability, implying that consistent delivery on margins and cash conversion may be enough to support a gradual rerating from recent trading levels.
Comparative coverage that pairs KPN with North American peers underscores its different proposition: lower volatility and income over hyper‑growth. That positioning can work if execution is steady and the dividend remains intact. The main swing factors for total return are the trajectory of free cash flow and leverage. Should FCF expand from current levels and debt drift lower, the equity could see valuation support and a tighter risk premium. Conversely, a squeeze—whether from competition, regulation, or higher funding costs—could cap capital returns and keep the stock range‑bound. Net‑net, absent a structural shock, the three‑year setup favors incremental progress: measured revenue growth, stable to slightly better margins, and cautious balance‑sheet repair.
What could happen in three years? (horizon October 2025+3)
| Scenario | Equity narrative | Operations | Capital returns |
|---|---|---|---|
| Best | Low‑beta income compounder rerates on consistent cash conversion and modest deleveraging. | Revenue growth stays positive; margins hold or improve on cost discipline. | Dividend maintained or edged up; opportunistic buybacks possible if leverage trends down. |
| Base | Range‑bound total return driven mainly by the dividend; valuation broadly stable. | Steady execution with small efficiency gains; earnings growth resumes gradually. | Dividend maintained; balance sheet kept in check with selective debt reduction. |
| Worse | Multiple compresses on cash‑flow pressure or regulatory/competitive setbacks. | Margins compress; growth slows; refinancing terms tighten. | Dividend coverage tightens; policy reviewed or trimmed to preserve balance‑sheet flexibility. |
Projected scenarios are based on current trends and may vary based on market conditions.
Factors most likely to influence the share price
- Dividend policy versus cash generation – payout ratio (89.47%) against operating and free cash flow (2.16B and 662M).
- Competitive intensity and pricing in mobile and broadband – impact on revenue growth (5.90% YoY) and margins (23.83% operating).
- Regulatory and spectrum dynamics – costs, compliance and any market‑structure changes affecting profitability.
- Balance‑sheet management – total debt (7.15B), debt/equity (207.96%) and refinancing conditions; liquidity (current ratio 0.72).
- Network reliability, security and customer experience – churn, reputation, and medium‑term ARPU trends.
- Strategic actions (partnerships, asset sales/buybacks) and their effect on leverage and per‑share economics.
Conclusion
KPN’s profile into 2028 looks anchored by steady demand, solid margins and dependable cash generation, offset by a leveraged balance sheet and a high payout ratio. The investment case therefore leans on execution: keeping revenue inching forward, defending profitability, and converting earnings to cash while carefully managing debt. The stock’s low beta and 4.36% forward yield can continue to attract income‑focused holders, but material upside likely requires evidence that earnings growth has turned the corner after recent softness and that free cash flow can expand without increasing leverage. In a base case, investors could see most of their return from dividends with modest capital appreciation; in a better case, gradual deleveraging and sustained cash conversion support a rerating. Conversely, funding cost pressure or competitive setbacks would challenge the dividend’s headroom and cap valuation. Overall, a patient, income‑oriented outlook appears most appropriate.
This article is not investment advice. Investing in stocks carries risks and you should conduct your own research before making any financial decisions.


