


BP enters late 2025 with a mixed setup: a share price that recovered from a spring wobble, stronger Q2 momentum, and a clearer project slate after revising capital expenditure guidance, offset by thin reported profitability and mounting regulatory scrutiny in Europe. Revenue sits around 184.81B, but bottom-line results have been muted despite solid operating cash generation, highlighting the gap between cash metrics and accounting earnings that is common in energy. The company has reshaped its portfolio with asset sales and new low‑carbon partnerships while engaging regulators on emissions standards, all as refining capacity in Europe faces structural pressure. For investors, the core question is whether upstream and trading cash flows can reliably fund dividends and selective growth while the energy transition accelerates. Forward dividend yield near 5.84% keeps income support in focus, but coverage depends on execution and commodity conditions. In sector context, European majors are balancing hydrocarbon cash engines with transition investments amid rationalizing refining, shifting policy, and capital discipline.
Key Points as of October 2025
- Revenue: 184.81B (ttm); quarterly revenue growth (yoy) at -1.30% indicates a modest top-line contraction.
- Profit/Margins: Operating margin 9.13% vs profit margin 0.31% (ttm), underscoring heavy below-the-line drag despite operational throughput; EBITDA 27.35B.
- Cash generation: Operating cash flow 23.29B and levered free cash flow 9.31B; payout ratio 754.09% reflects thin reported earnings versus dividend commitments.
- Balance sheet: Total cash 35.31B; total debt 74.98B; debt/equity 93.99%; current ratio 1.21.
- Sales/Backlog: Backlog not disclosed; pipeline flagged in headlines includes Gulf of Mexico project under environmental review and new offshore wind/hydrogen initiatives.
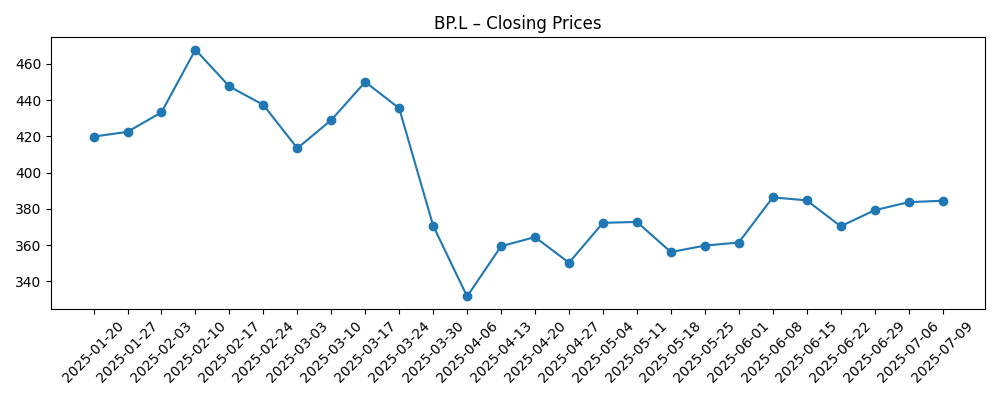
- Share price: Last weekly close 422.0 on 2025-10-13; 52-week high 472.25; 50-day moving average 425.19 vs 200-day 404.43; beta 0.38; 52-week change 2.96%.
- Analyst view: Not disclosed in the provided data; newsflow emphasizes capex discipline and sensitivity to regulatory outcomes.
- Market cap: Data not disclosed in the provided dataset.
- Strategy/regulation: Revised capex guidance; discussions with European regulators on emissions; portfolio reshaping (petrochemicals sale) and partnerships in offshore wind and hydrogen.
Share price evolution – last 12 months
Notable headlines
- Shell, BP en TotalEnergies: raffinagebedrijven verdwijnen overal als hart van industrie Europa, ’honderdduizenden banen op het spel [De Telegraaf - Financieel]
- BP PLC revises capex guidance following new project developments [BP Official Website]
- BP PLC Reports Strong Q2 2025 Earnings Amid Rising Energy Prices [Reuters]
- BP in Talks with European Regulators Over New Emissions Standards [Financial Times]
- BP PLC Announces Partnership with Danish Offshore Wind Developer [Bloomberg]
- BP's Gulf of Mexico Drilling Plans under Environmental Review [Wall Street Journal]
- BP Completes Sale of Petrochemical Business to INEOS [BBC]
- BP's New CEO Outlines Vision for Net Zero Transition [The Guardian]
- BP's Strategic Investments in Hydrogen Energy Set to Increase [Hydrogen Insight]
Opinion
BP’s recent prints tell a nuanced story. On the one hand, Reuters flagged a strong Q2 2025 lift from firmer energy prices, and the operating margin of 9.13% suggests the industrial engine is turning. On the other, the profit margin at 0.31% and net income of 0.562B (ttm) show that reported earnings remain thin. The divergence between EBITDA and net income, paired with robust operating cash flow of 23.29B, points to non-cash charges and working-capital dynamics that can mask underlying health. Quarterly revenue growth at -1.30% (yoy) also underscores that pricing and mix, rather than volume expansion, did much of the work. For a three‑year view, the quality and repeatability of cash flow matter more than any single quarter: the core question is whether upstream volumes, trading, and advantaged refining/marketing can consistently translate into free cash flow through the cycle.
Capital allocation is the second pillar. Management revised capex guidance following new project developments, but no figures were disclosed here; that keeps execution risk squarely in focus. With levered free cash flow of 9.31B and total cash of 35.31B against 74.98B of debt, BP has flexibility, yet the payout ratio of 754.09% on thin earnings highlights that dividend optics hinge on cash rather than GAAP profit. The forward yield is supportive, but sustainability depends on commodity prices, project ramp‑ups, and discipline on spend. Balance sheet metrics (debt/equity 93.99%, current ratio 1.21) argue for measured investment pacing. In the next three years, proving capex generates visible cash returns faster than it dilutes returns on equity will likely shape the equity story.
Industry structure could offer both headwinds and tailwinds. European refining rationalization, as highlighted in recent coverage, may tighten product markets and help remaining assets, yet it reinforces a secular shift away from legacy fuels. Regulatory scrutiny is intensifying: BP’s talks with European regulators over emissions and the environmental review of Gulf of Mexico plans extend approval timelines and add compliance costs. At the same time, portfolio moves—the sale of petrochemicals to INEOS and partnerships in offshore wind and hydrogen—push BP deeper into transition platforms. These steps can de‑risk policy exposure and open new cash-flow lanes, but returns and timing remain project-specific.
How that mix lands will shape the market multiple and narrative. Today, the shares trade with low beta (0.38) and sit below the 52-week high, with technicals (50‑day vs 200‑day averages) showing stabilization after spring volatility. Over the next three years, clearer evidence of steady free cash flow through cycles, balanced with credible low‑carbon growth and regulatory clarity, could pivot perception from “transition uncertainty” to “cash-yield plus option value.” Conversely, a scenario of softer commodities, stricter emissions costs, and delays in offshore wind or Gulf approvals would likely keep the equity on a discount and tighten financial headroom for both dividends and growth.
What could happen in three years? (horizon October 2025+3)
| Scenario | Narrative |
|---|---|
| Best | Commodity prices hold in a supportive band, major upstream projects reach first oil on time, and revised capex is executed with strong discipline. Low‑carbon partnerships scale with contracted offtake, easing regulatory friction. Free cash flow consistency reframes BP as a reliable cash‑returner with credible transition optionality, improving sentiment and narrowing any perceived valuation discount. |
| Base | Prices normalize, operational uptime is solid, and capex is paced to cash generation. Regulatory processes add time but remain manageable. Transition projects progress selectively, with a focus on returns. The equity narrative centers on stable dividends funded by diversified cash flows, with range‑bound valuation tied to macro swings. |
| Worse | A weaker commodity tape and tighter emissions rules compress margins, while project approvals lag (e.g., offshore and Gulf timelines). Cash conversion softens, forcing tougher capital allocation choices and testing dividend optics. Strategy remains intact but re‑sequenced, and the equity retains a cautionary stance until visibility rebuilds. |
Projected scenarios are based on current trends and may vary based on market conditions.
Factors most likely to influence the share price
- Commodity price trajectory for oil and gas, and refining margins across Europe.
- Regulatory outcomes on emissions standards in Europe and environmental reviews in the Gulf of Mexico.
- Execution against revised capex guidance and timing of major project start‑ups.
- Cash conversion (OCF and FCF) versus dividend commitments and balance sheet leverage.
- Portfolio reshaping (divestments/partnerships in petrochemicals, wind, hydrogen) and realized returns.
- Macroeconomic demand trends and FX movements affecting trading and marketing.
Conclusion
BP’s three‑year setup is a balance of cash flow resilience and transition execution risk. The operational engine is evident in a 9.13% operating margin and 23.29B of operating cash flow, but thin reported earnings and a high payout ratio elevate the importance of disciplined capex and regulatory navigation. Portfolio moves point to a more focused core plus option value in wind and hydrogen, while European refining rationalization and policy pressure reshape the opportunity set. The equity’s lower beta and recovery from spring weakness suggest stabilization, yet sustained rerating likely requires consistent free cash flow through cycles, visible returns on new projects, and smoother permitting. Watch next 1–2 quarters: capex phasing versus cash generation; outcomes from emissions‑standards discussions; approvals and timelines for Gulf of Mexico activity; progress on offshore wind partnerships; dividend coverage versus free cash flow. Together, these will shape confidence in BP’s ability to fund distributions and selective growth while navigating a tightening regulatory environment.
This article is not investment advice. Investing in stocks carries risks and you should conduct your own research before making any financial decisions.


