


Advantest (6857.T), a leading semiconductor test equipment maker, enters August 2025 with strong operating momentum and a volatile but upward-trending share price. The stock has climbed 68.29% over 12 months and recently traded around ¥11,295, within sight of its ¥12,040 52‑week high, after rebounding from April lows. Fundamentals are robust: trailing‑12‑month revenue stands at ¥904.76 billion with 90.10% year‑over‑year quarterly growth, while operating and net margins of 46.99% and 25.14% underscore healthy pricing and mix. Cash generation remains solid (TTM operating cash flow ¥305.14 billion; free cash flow ¥242.93 billion) against modest debt of ¥91.78 billion, supporting flexibility through a cyclical capex environment tied to AI and advanced nodes. With a 0.35% dividend yield and a 17.89% payout ratio, Advantest offers income discipline alongside growth, though results remain sensitive to the timing of customer capital spending.
Key Points as of August 2025
- Revenue: TTM revenue ¥904.76B; quarterly revenue growth (yoy) 90.10%.
- Profit/Margins: Profit margin 25.14%; operating margin 46.99%; gross profit ¥539.82B; diluted EPS 217.99.
- Cash flow: Operating cash flow (TTM) ¥305.14B; levered free cash flow (TTM) ¥242.93B.
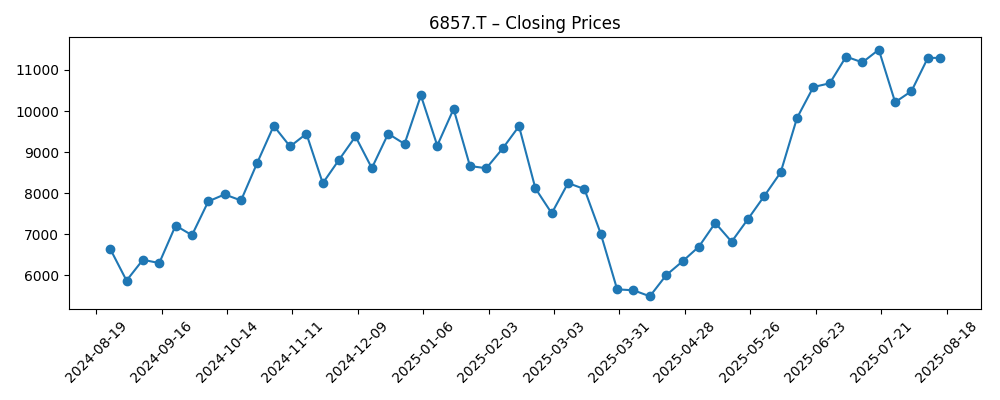
- Share price: Rose from a mid‑April weekly close of ¥5,485 to ¥11,295 by Aug 15; 52‑week change 68.29%; 52‑week high ¥12,040; low ¥4,703; 50‑day MA ¥10,239.48; 200‑day MA ¥8,634.33.
- Analyst view: Market focus on AI and advanced‑node test intensity; sentiment hinges on sustainability of rapid recent growth and capex timing.
- Market cap: About ¥8.27T (price × shares outstanding 731.79M).
- Balance sheet: Cash ¥273.41B vs debt ¥91.78B; current ratio 2.26; debt/equity 15.98%.
- Dividend/Ownership: Annual dividend ¥39 (0.35% yield; payout 17.89%); institutions hold 60.40%; last split 4:1 (9/28/2023); ex‑div 3/28/2025.
Share price evolution – last 12 months
Notable headlines
Opinion
Advantest’s equity story into 2028 hinges on whether today’s exceptional growth can transition into a durable, multi‑year cycle. The stock’s trajectory since spring—recovering from April’s weekly close near ¥5,485 to around ¥11,295 by mid‑August—suggests investors are reassessing the longevity of AI‑related demand. With a 50‑day moving average above the 200‑day, price action supports a constructive trend, while a 0.67 beta implies lower market sensitivity than many peers. The fundamentals justify optimism: a 46.99% operating margin and 25.14% net margin indicate healthy product mix and pricing power. Yet the key is order visibility. As hyperscale, foundry and memory capex schedules ebb and flow, Advantest’s quarterly cadence can remain choppy, keeping volatility elevated around prints even if the medium‑term setup stays favorable.
The test intensity attached to advanced nodes, high‑bandwidth memory and advanced packaging continues to rise, and that is a structural tailwind. Quarterly revenue growth of 90.10% year over year underscores the magnitude of the current upcycle. However, such comps get tougher in 2026, and a pause in orders—common in semi equipment—could test patience. Gross profit of ¥539.82B and strong operating leverage provide cushion, but any pricing pressure or delays in new platform ramps could dent margins. Still, Advantest’s position in SoC and memory testers aligns it with the parts of the industry growing fastest, and diversified end‑customers can help smooth single‑segment swings, provided supply chains remain stable and lead times manageable.
Balance sheet strength is a critical differentiator. With ¥273.41B in cash versus ¥91.78B in debt and a 2.26 current ratio, the company retains flexibility to invest through the cycle—supporting R&D, capacity, and service networks—without overreliance on external funding. Free cash flow of ¥242.93B (TTM) enables disciplined capital allocation while maintaining a 17.89% payout ratio and a modest 0.35% yield. Even if orders normalize, this financial profile can sustain product development and field support that are essential in competitive bids. In tougher quarters, the cushion may mitigate the need for abrupt cost cuts that can undermine long‑term positioning, preserving customer relationships and installation base momentum.
From a market perspective, the path back to the ¥12,040 52‑week high will likely depend on order momentum into 2026 and signs that AI‑driven test demand is broadening beyond a handful of flagship programs. The 50‑day and 200‑day moving averages provide useful technical reference points for traders, but fundamentals will dominate: shipment lead times, new platform qualifications, and geographic demand mix. If management can maintain high‑20s net margins and robust cash conversion while navigating any capex pauses, investors may be willing to underwrite a longer runway. Conversely, a synchronized slowdown across foundry and memory could re‑rate the shares until orders re‑accelerate. On balance, the three‑year setup looks constructive, but execution on product cycles and service quality remains paramount.
What could happen in three years? (horizon August 2025+3)
| Scenario | Narrative to August 2028 | Implications |
|---|---|---|
| Best | AI/advanced‑node demand remains elevated; test intensity rises with new nodes and packaging; supply chain steady; margins resilient. | Shares sustain leadership and retest the ¥12,040 high; cash builds, supporting continued investment and dividend capacity. |
| Base | Capex growth moderates; orders stagger but remain healthy; product mix keeps margins close to recent levels; service revenue grows. | Stock oscillates around trend, using the 200‑day average as a support reference; steady free cash flow funds disciplined R&D and support. |
| Worse | Foundry and memory capex pause simultaneously; order pushouts and pricing pressure emerge; component availability tightens. | Shares retrace toward prior troughs; investment pace slows, but net cash and cash generation help cushion downside and preserve options. |
Projected scenarios are based on current trends and may vary based on market conditions.
Factors most likely to influence the share price
- Semiconductor capex timing across foundry, logic and memory, especially AI/HBM‑related programs.
- Product mix and pricing power sustaining margins (46.99% operating; 25.14% net) through cycle transitions.
- Order visibility and lead times for new tester platforms and services, including qualification milestones.
- Competitive dynamics and technological shifts that alter test intensity at advanced nodes and in advanced packaging.
- Currency and macro factors affecting customer budgets, plus any export/industry policy constraints.
Conclusion
Advantest’s fundamentals—rapid top‑line expansion, strong margins, and solid cash generation—position the company well for a three‑year horizon shaped by AI and advanced‑node investment. The equity has already reflected part of this optimism, with a 68.29% 52‑week advance and a recovery toward the ¥12,040 high. From here, the debate centers on the depth and duration of the test upcycle. If orders broaden and normalize at healthy levels, Advantest’s balance sheet and profitability should support continued product investment and service expansion, potentially reinforcing competitive advantages. If a synchronized capex pause hits, the same strengths could cushion earnings and preserve long‑term capacity to reinvest. With a low payout ratio and moderate beta, the shares offer a balanced profile: exposure to secular growth with some downside buffers. Execution on product ramps and customer delivery will likely determine whether the stock consolidates gains or extends them into 2028.
This article is not investment advice. Investing in stocks carries risks and you should conduct your own research before making any financial decisions.


