
Reckitt Benckiser (RKT.L) heads into the next three years from a position of relative strength but with clear trade‑offs. The shares recently closed at 5,710, near a 52‑week high of 5,722 and up 25.12% over 12 months, sitting above the 50‑day and 200‑day moving averages. Fundamentals show resilient profitability (21.46% operating margin; 8.88% net margin) on trailing‑twelve‑month revenue of 13.98B, yet near‑term momentum has softened: quarterly revenue fell 2.60% year over year and quarterly earnings declined 16.10%. Balance‑sheet flexibility is serviceable but not unconstrained, with 9.4B total debt, 963M cash, a 0.56 current ratio and debt/equity of 148.11%. The defensive profile (beta 0.07) and a forward dividend yield of 3.63% support the case for patience, though a 110.14% payout ratio puts the onus on cash generation and an earnings recovery to sustain current distributions.
Key Points as of September 2025
- Revenue: Trailing‑twelve‑month revenue of 13.98B; most recent quarterly revenue growth (yoy) −2.60%.
- Profit/Margins: Profit margin 8.88%; operating margin 21.46%; EBITDA 3.56B; net income (ttm) 1.25B.
- Sales/Backlog: No backlog metric disclosed; recent quarterly earnings growth (yoy) −16.10% signals near‑term softness.
- Share price: Latest weekly close 5,710 (2025‑09‑05); 52‑week high 5,722; 50‑day MA 5,347.76; 200‑day MA 5,098.02; 52‑week change 25.12%; beta 0.07.
- Analyst view: No ratings cited; valuation implies recovery expectations (trailing P/E 30.94 vs forward P/E 15.72; PEG 4.33).
- Market cap: 38.45B; Enterprise Value 46.78B; EV/EBITDA 16.91; Price/Sales 2.80; Price/Book 6.09.
- Balance sheet: Total debt 9.4B; cash 963M; current ratio 0.56; debt/equity 148.11%; ROE 17.37%; ROA 8.01%.
- Dividend: Forward yield 3.63%; payout ratio 110.14%; last ex‑dividend date 2025‑08‑07.
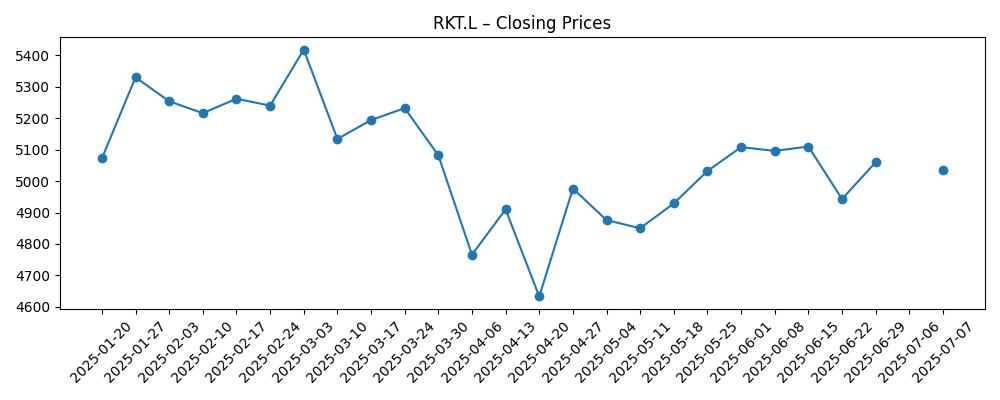
Share price evolution – last 12 months
Notable headlines
Opinion
The share price has worked higher through 2025, with July–September strength lifting RKT.L to the top of its 52‑week range. Trading above both the 50‑day and 200‑day moving averages signals improving sentiment, while a five‑year beta of 0.07 underscores a defensive, low‑volatility profile that typically appeals in late‑cycle conditions. That resilience is underpinned by a 21.46% operating margin and steady cash generation, even as near‑term growth has cooled. The valuation gap between a 30.94 trailing P/E and a 15.72 forward P/E suggests the market is baking in an earnings recovery over the next 12 months. If delivery is in line with those expectations, the multiple can compress for the right reasons (higher earnings), supporting the current price level. Conversely, failure to re‑accelerate could invite a de‑rating from elevated EV/EBITDA of 16.91.
Operationally, the company’s profitability gives it options, but recent prints remind investors that execution matters. Quarterly revenue growth at −2.60% and earnings growth at −16.10% year over year point to pockets of pressure—be it mix normalization or elasticity as pricing resets. The near‑term task is to protect gross profit (8.51B ttm) and sustain brand investment while keeping a line of sight to working‑capital discipline. With return on equity at 17.37% and return on assets at 8.01%, the core engine remains efficient. The strategic emphasis over the next three years likely revolves around incremental efficiency gains, prudent pricing architecture, and targeted innovation that supports volume without sacrificing margins. If management can stabilize volumes as inflation fades and supply chains normalize, mid‑cycle operating leverage could reappear, helping to validate the forward multiple.
Capital allocation will be closely watched. The balance sheet shows 9.4B of total debt against 963M of cash and a current ratio of 0.56, keeping the focus on cash conversion. Levered free cash flow of 1.69B (ttm) provides room to manage obligations, but the 110.14% payout ratio raises the bar for sustaining the dividend solely from earnings. In a benign scenario, steady operating cash flow (2.51B ttm) and disciplined capex can support both deleveraging and distributions. In a tougher environment, management may prioritize balance‑sheet resilience, which could mean slower buybacks or revisiting payout mechanics to ensure coverage. Over a three‑year horizon, a credible path to lower leverage and an improving current ratio would likely be rewarded with a higher quality premium, even if headline growth remains modest.
Valuation is the swing factor. At Price/Sales of 2.80 and EV/EBITDA of 16.91, investors are paying for consistency and brand strength while awaiting a growth upturn. The forward dividend yield of 3.63% adds support, particularly for income‑oriented holders in defensive sectors. If earnings recover in line with the forward P/E of 15.72, total return could be driven by dividends plus modest earnings growth, with the share price tracking the 50‑day average on dips. If revenue or earnings miss, the stock could drift back toward longer‑term averages as the market re‑prices to slower growth. Over three years, the most probable path is a grind higher anchored by margin discipline and cash generation, with upside dependent on re‑acceleration and downside capped by the portfolio’s defensive characteristics.
What could happen in three years? (horizon September 2025+3)
| Scenario | Operating outlook | Valuation/share dynamics |
|---|---|---|
| Best case | Revenue stabilizes then improves; margins sustained near current levels; cash conversion supports deleveraging and fully covers dividends. | Confidence builds as forward expectations are met; multiple compresses on rising earnings; shares sustain above long‑term averages and challenge new highs. |
| Base case | Low, steady growth with disciplined costs; margins broadly stable; balance sheet gradually strengthens without aggressive leverage reduction. | Range‑bound trading with a mild upward bias; dividend maintained; valuation remains near current relationships while tracking earnings progress. |
| Worse case | Prolonged volume pressure and input‑cost or FX headwinds; margins erode; dividend policy reassessed to protect balance‑sheet flexibility. | Derating from current EV/EBITDA and P/S; shares revert toward longer‑term averages and underperform defensives until fundamentals reset. |
Projected scenarios are based on current trends and may vary based on market conditions.
Factors most likely to influence the share price
- Execution on pricing, mix, and cost control to defend margins amid slowing quarterly growth.
- Input‑cost inflation and foreign‑exchange volatility affecting gross profit and cash generation.
- Competitive intensity and private‑label share gains impacting volumes and promotional spend.
- Balance‑sheet management: deleveraging pace, refinancing terms, and progress improving the current ratio.
- Dividend policy credibility given the 110.14% payout ratio and the trajectory of earnings recovery.
Conclusion
RKT.L enters the next three years with supportive technicals, resilient profitability, and a defensive risk profile, but must navigate softer near‑term growth and a stretched payout ratio. The market is signaling faith in an earnings recovery, as shown by the gap between trailing and forward P/Es, yet expectations now sit closer to the top of the 52‑week range. To earn that confidence, management’s priorities appear straightforward: protect margins, convert earnings to cash, and strengthen the balance sheet. If those pillars hold, the stock can compound through dividends plus moderate earnings growth, with lower volatility than the broader market. If the recovery stalls, a valuation reset is plausible from current EV/EBITDA and Price/Sales levels. On balance, a base‑case grind higher looks reasonable, with upside tied to re‑acceleration and downside mitigated by brand durability and low beta, making patience and selectivity prudent.
This article is not investment advice. Investing in stocks carries risks and you should conduct your own research before making any financial decisions.