
Koç Holding (KCHOL.IS) enters late 2025 balancing scale with caution. The diversified conglomerate reports trailing 12‑month revenue of 2.13T, gross profit of 321.33B and EBITDA of 84.92B, yet net income attributable to common is -5.22B and profit margin sits at -0.25%. Leverage is notable (total debt 1.05T; debt/equity 109.82%) and liquidity tight (current ratio 0.89), while operating and free cash flow are negative. Shares have been volatile: after an April low near 138.40, the stock recovered toward 186.30 in August before easing to roughly 166 by September 9; the 52‑week range is 133.70–207.80. With a forward dividend yield of 4.18% but an elevated payout ratio, investors face a trade‑off between income and coverage risk. This note outlines a three‑year outlook and key swing factors.
Key Points as of September 2025
- Revenue: TTM revenue 2.13T; gross profit 321.33B; EBITDA 84.92B; quarterly revenue growth (yoy) is -0.80%.
- Profit/Margins: Operating margin 4.07%; profit margin -0.25%; ROA 0.53%; ROE -1.90%.
- Sales/Backlog: Backlog not disclosed; revenue per share 841.21; quarterly earnings growth (yoy) 2,402.60% (base effects likely).
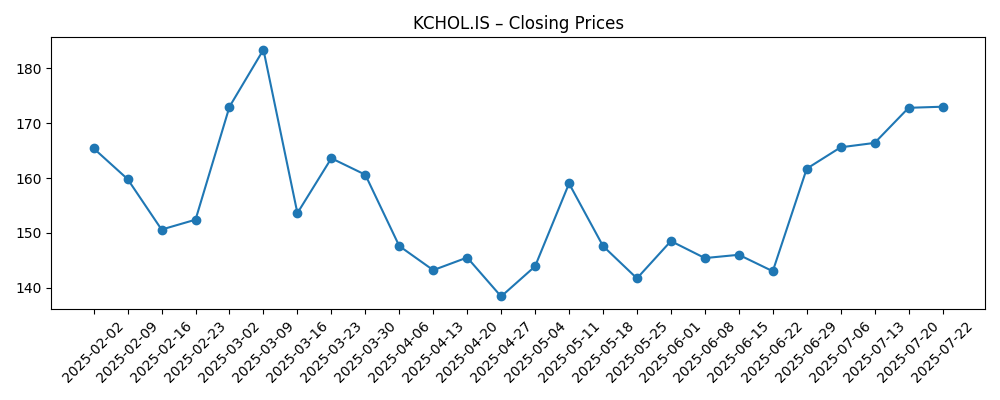
- Share price: Last print near 166 (Sep 9); 52‑week range 133.70–207.80; 50‑day MA 173.62 vs 200‑day MA 166.08; beta 0.53.
- Relative performance: 52‑week change -7.22% vs S&P 500 +18.19%.
- Dividend: Forward rate 6.88 with 4.18% forward yield; payout ratio 2,666.67%; ex‑dividend date was 4/10/2025; trailing dividend 0.00.
- Liquidity and leverage: Total cash 356.78B; total debt 1.05T; debt/equity 109.82%; current ratio 0.89; operating cash flow -2.22B; levered FCF -70.91B.
- Market cap/ownership: Market cap not stated; shares outstanding 2.54B; float 1.86B; insiders hold 57.19%; institutions 6.19%.
Share price evolution – last 12 months
Notable headlines
Opinion
Price action sets the tone for the next leg. Over the past six months, KCHOL.IS fell into late April (low ~138.40), rebounded to an August swing high (~186.30), and has retraced toward the 200‑day moving average (166.08) while sitting below the 50‑day (173.62). The 52‑week change of -7.22% contrasts with the S&P 500’s +18.19%, underlining relative underperformance despite a low 0.53 beta. For long‑only investors, that combination suggests a defensive profile but limited near‑term momentum until earnings quality and cash conversion improve. A sustained close back above the 50‑day average would signal improving sentiment; conversely, repeated failures near that level could keep the stock range‑bound between the mid‑160s and the mid‑180s, with the 133.70–207.80 52‑week range framing downside and upside guardrails.
The dividend is a focal point. The forward yield screens attractive at 4.18%, but the indicated payout ratio of 2,666.67% and TTM net income of -5.22B flag coverage risk if earnings and cash flow do not normalize. Operating cash flow (-2.22B) and levered free cash flow (-70.91B) reinforce that picture. Offsetting this, the group’s scale and cash on hand (356.78B) provide room to manage the policy through a downturn or time a recalibration. Investors should watch whether subsequent quarters demonstrate improved cash conversion alongside the reported surge in quarterly earnings growth (2,402.60% yoy), which may partly reflect base effects. Clarity on the balance between sustaining the payout and preserving balance‑sheet flexibility is likely to be a key share‑price driver.
Balance sheet and profitability form the second pillar. Leverage is meaningful (1.05T total debt; debt/equity 109.82%) and short‑term liquidity appears tight (current ratio 0.89). With an operating margin of 4.07% and a near‑breakeven profit margin (-0.25%), incremental efficiency gains and portfolio mix shifts can have outsized effects on equity value. The TTM revenue base of 2.13T gives scope to compound small margin improvements into sizable earnings, but the priority is translating those into positive free cash flow. Any credible path to deleveraging — whether through internal cash generation, disciplined capex, or portfolio actions — could compress the equity risk premium and re‑rate the shares. Conversely, if cash burn persists, refinancing needs could dominate the narrative and cap valuation.
Looking three years out, a base case is gradual stabilization: modest top‑line growth off a -0.80% yoy quarterly dip, margin repair from operational discipline, and a measured reduction of balance‑sheet risk. The low beta (0.53) and high insider ownership (57.19%) suggest a less volatile trade once fundamentals firm up, though limited free float may amplify idiosyncratic moves. Catalysts to monitor include evidence of sustained earnings quality beyond base effects, a turn in operating cash flow, and any adjustment to dividend policy that improves coverage without eroding investor trust. Should these emerge, a re‑rating toward the upper end of the recent trading band is plausible; absent progress, retests of the lower band cannot be ruled out within the 133.70–207.80 range.
What could happen in three years? (horizon September 2025+3)
| Scenario | Narrative | Implications for shares |
|---|---|---|
| Best | Steady revenue expansion from the 2.13T TTM base, operating discipline lifts margins from current levels (4.07% operating; -0.25% net), operating cash flow turns positive and deleveraging begins from 109.82% debt/equity. | Re‑rating toward the upper end of the recent 133.70–207.80 range with potential to establish higher highs if cash generation proves durable. |
| Base | Top line remains broadly stable (quarterly revenue growth oscillating around flat), earnings quality improves from the 2,402.60% yoy spike, dividend policy is recalibrated for coverage, and liquidity metrics trend modestly better from a 0.89 current ratio. | Shares consolidate around long‑term averages (200‑day near 166.08), with episodic rallies toward the mid‑to‑upper band. |
| Worse | Cash flow stays negative (OCF and FCF remain under pressure), leverage persists near current levels (1.05T debt; 109.82% D/E), and margins stagnate; any dividend cut without a clear strategy weighs on sentiment. | Valuation compresses; risk of retesting the low end of the 52‑week range and prolonged range‑bound trading. |
Projected scenarios are based on current trends and may vary based on market conditions.
Factors most likely to influence the share price
- Dividend policy and coverage relative to earnings (payout ratio 2,666.67%) and cash flow.
- Cash‑flow inflection from negative operating and free cash flow toward sustained positives.
- Leverage and refinancing conditions given total debt of 1.05T and debt/equity of 109.82%.
- Execution on margin improvement from a 4.07% operating margin and stabilization of net profitability.
- Market liquidity and ownership dynamics (57.19% insider holdings; 1.86B float; average 3‑month volume 28.08M).
Conclusion
Koç Holding’s investment case into 2028 hinges on converting scale into cash and moderating balance‑sheet risk. The group’s size (2.13T TTM revenue) and diversified exposure offer resilience, but profitability remains thin (4.07% operating margin; -0.25% net) and cash generation is currently negative. The stock’s low beta (0.53) and high insider ownership can cushion volatility, yet relative performance has lagged (52‑week change -7.22% versus the S&P 500’s +18.19%). A sustainable turn in operating cash flow, visible deleveraging from 109.82% D/E, and transparent dividend policy aligned with earnings are the clearest re‑rating levers. In the base case, that mix points to steadying returns and a path back toward the upper portion of the 133.70–207.80 range. Without progress on these fronts, the shares may remain range‑bound and sensitive to macro and funding headlines.
This article is not investment advice. Investing in stocks carries risks and you should conduct your own research before making any financial decisions.