
HSBC Holdings (HSBA.L) enters the next three years from a position of strength but with clear crosswinds. Over the past 12 months the share price is up 45.67%, outpacing the S&P 500’s 18.47%, and sits near a 52‑week high of 981.80 (low: 645.50). Under the hood, trailing‑twelve‑month revenue is 56.21B and net income attributable to common is 17.84B, supporting robust profit and operating margins of 33.67% and 46.56%. Yet normalization is visible: quarterly revenue growth is -11.0% year over year and quarterly earnings growth is -27.5%. Balance‑sheet liquidity remains substantial (total cash 1.11T versus total debt 746.42B), with return on equity at 10.13% and beta of 0.52. Income investors will note a forward annual dividend yield of 5.18% with a 63.79% payout ratio. These markers frame HSBC’s risk‑reward into 2026–2028.
Key Points as of September 2025
- Revenue: TTM revenue 56.21B; revenue per share 3.15; quarterly revenue growth (yoy) -11.0%.
- Profit/Margins: Profit margin 33.67%; operating margin 46.56%; ROE 10.13%; ROA 0.64%.
- Sales/Backlog: No formal backlog disclosure; operating cash flow 7.55B TTM; watch top‑line normalization and fee income trends.
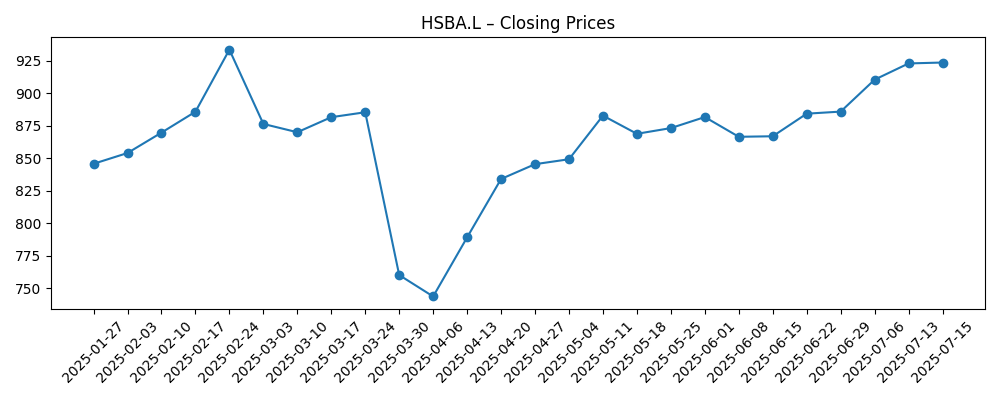
- Share price: Last weekly close near 963 (5 Sep 2025); 52‑week range 645.50–981.80; 50‑DMA 935.44; 200‑DMA 861.28.
- Dividend: Forward annual rate 0.5 with a 5.18% yield; payout ratio 63.79%; recent ex‑dividend date 8/14/2025.
- Balance sheet: Total cash 1.11T vs total debt 746.42B; book value per share 9.88.
- Analyst view: Market focus on margin durability vs. -11.0% revenue contraction and dividend sustainability; beta 0.52 implies lower volatility versus peers.
- Ownership/liquidity: Shares outstanding 17.31B; institutions hold 45.68%, insiders 0.37%; average volume 17.86M (3‑month) vs 19.75M (10‑day).
- Momentum: 52‑week change 45.67% versus S&P 500’s 18.47%; price action recovered from a late‑March dip to 760.
Share price evolution – last 12 months
Notable headlines
Opinion
HSBC’s share price resilience over the past year signals investor confidence in its margin strength and capital return, even as top‑line growth cools. The stock has advanced from the lower end of its 52‑week range (645.50) to near the high (981.80), with the latest weekly close around 963 and both 50‑ and 200‑day moving averages trending upward. That said, the data also flag normalization: quarterly revenue growth at -11.0% and quarterly earnings growth at -27.5% year over year suggest the rate‑cycle tailwind is moderating. For the next three years, the debate should center on how quickly net interest income and fee lines rebalance against costs, and whether management can defend today’s 33.67% profit margin and 46.56% operating margin. If ROE (10.13%) holds or improves while credit costs stay contained, the equity story can remain income‑led with selective growth optionality.
The dividend profile is a cornerstone of the bull case. A forward yield of 5.18% with a 63.79% payout ratio looks supportable given current profitability and liquidity, though coverage will tighten if earnings pressure persists. The recent 8/14/2025 ex‑dividend date underscores a cadence that can attract income‑focused holders, particularly with beta at 0.52 offering a smoother ride than higher‑beta financials. Over 2026–2028, sustainable distributions likely hinge on balancing investment in technology and controls with ongoing cost discipline. Any acceleration in operating cash flow (7.55B TTM) would improve dividend visibility, while a pause or reversal would prompt a reassessment of cash returns versus balance‑sheet strength. On balance, the income thesis remains intact but sensitive to top‑line trends.
Technically, HSBC has rebuilt momentum after a sharp dip to 760 in late March 2025, reclaiming and holding above the 50‑ and 200‑day moving averages (935.44 and 861.28). Participation looks healthy, with 10‑day average volume (19.75M) exceeding the 3‑month average (17.86M), though that can also amplify downside moves if sentiment shifts. With the stock near its 52‑week high, expectations appear elevated; disappointments on revenue or credit quality could catalyze a pullback toward intermediate supports. Conversely, confirmation that margins can remain robust despite slowing revenue should be rewarded. For long‑term investors, trend adherence matters less than whether fundamental normalization finds a floor before pressuring capital return plans. In that context, the next few quarters of revenue cadence (currently -11.0% yoy) may drive the path of least resistance.
Strategically, HSBC’s three‑year arc likely emphasizes efficiency and disciplined allocation. The balance sheet (1.11T cash vs 746.42B debt) provides flexibility, but management’s challenge will be protecting ROE (10.13%) while navigating a maturing rate cycle and potential shifts in loan demand and fees. With a large shareholder base (17.31B shares outstanding; 45.68% institutional, 0.37% insider), signaling clarity around dividend policy and investment priorities should remain a key catalyst. If revenue stabilization coincides with steady margins, the market can look through near‑term growth indigestion; if not, the risk is a valuation wobble as the narrative pivots from yield to earnings durability. The setup into 2026–2028 is therefore finely balanced: quality and income are evident, but growth proof points will be essential to extend the rally.
What could happen in three years? (horizon September 2025+3)
| Scenario | Operating backdrop | Financial implications | Share price bias | Key markers to watch |
|---|---|---|---|---|
| Best case | Rate path and funding costs settle favorably; stable demand for lending and services; disciplined costs. | Margins remain robust; revenue contraction bottoms and trends better; dividend maintained or improved with comfortable coverage. | Upward bias from current levels as yield and earnings both look sustainable. | Improving quarterly revenue trend, steady ROE, positive operating cash flow momentum, low realized volatility vs beta 0.52. |
| Base case | Normalization persists; mixed fee and lending activity; ongoing cost control offsets part of top‑line softness. | Earnings stabilize; dividend sustained at current framework; balance sheet flexibility preserved. | Range‑bound with periodic swings around moving averages and the 52‑week range. | Quarterly revenue growth oscillates near flat; payout ratio broadly steady; volumes near 3‑month average. |
| Worse case | Sharper macro slowdown or credit stress; rate dynamics compress margins faster than costs adjust. | Earnings pressure builds; dividend policy re‑evaluated; liquidity stays ample but market sentiment weakens. | Downward bias toward prior support levels if confidence in earnings durability fades. | Persistently negative revenue growth, weaker operating cash flow, rising payout strain, breaks below 200‑DMA. |
Projected scenarios are based on current trends and may vary based on market conditions.
Factors most likely to influence the share price
- Interest‑rate path and deposit/funding mix impacting net interest margins and revenue (currently -11.0% yoy).
- Earnings durability versus dividend commitments (forward yield 5.18%; payout ratio 63.79%).
- Credit quality and macro growth trends affecting operating cash flow (7.55B TTM) and ROE (10.13%).
- Cost discipline and execution on productivity, sustaining profit (33.67%) and operating margins (46.56%).
- Market sentiment and liquidity, including volume trends (10‑day 19.75M vs 3‑month 17.86M) and beta (0.52).
Conclusion
HSBC’s setup into 2026–2028 is a balance of income strength and growth normalization. The bank boasts high trailing margins, ample liquidity (1.11T cash vs 746.42B debt), and a forward dividend yield of 5.18% supported by a 63.79% payout ratio. Offsetting this, quarterly revenue and earnings declines (-11.0% and -27.5% yoy) indicate the tailwinds of the prior rate cycle are fading, keeping the path of earnings more uncertain. Price action near the 52‑week high and above both the 50‑ and 200‑day moving averages reflects confidence but also raises the bar for upcoming prints. Over the next three years, stabilization of revenue cadence and preservation of return metrics (ROE 10.13%) are likely to dictate whether the stock extends gains or settles into a yield‑driven, range‑bound trade. For now, risk‑reward appears balanced, with dividend carry providing a cushion against cyclical bumps.
This article is not investment advice. Investing in stocks carries risks and you should conduct your own research before making any financial decisions.