
As of September 2025, BP PLC (BP.L) enters the next three years balancing income appeal with cyclical risks. The shares trade near 415.65, within a 52‑week range of 329.20–472.25, and exhibit a low 5‑year beta of 0.42. Fundamentals show scale (revenue ttm 184.81B) but thin accounting profitability (profit margin 0.31%; operating margin 9.13%) alongside robust cash generation (operating cash flow 23.29B; levered free cash flow 9.31B). The balance sheet holds 35.31B cash against 74.98B debt (debt/equity 93.99%) with a 1.21 current ratio. Income investors focus on a forward dividend yield of 5.74% (rate 0.25), though the high payout ratio reflects low reported EPS. With quarterly revenue down 1.30% year over year and sector conditions in flux, the base case hinges on disciplined capex, steady operations and commodity price stability.
Key Points as of September 2025
- Revenue: ttm 184.81B; revenue per share 11.62; quarterly revenue growth (yoy) −1.30%.
- Profit/Margins: profit margin 0.31%; operating margin 9.13%; EBITDA 27.35B; net income 0.562B.
- Cash flow: operating cash flow 23.29B; levered free cash flow 9.31B.
- Balance sheet: total cash 35.31B; total debt 74.98B; debt/equity 93.99%; current ratio 1.21.
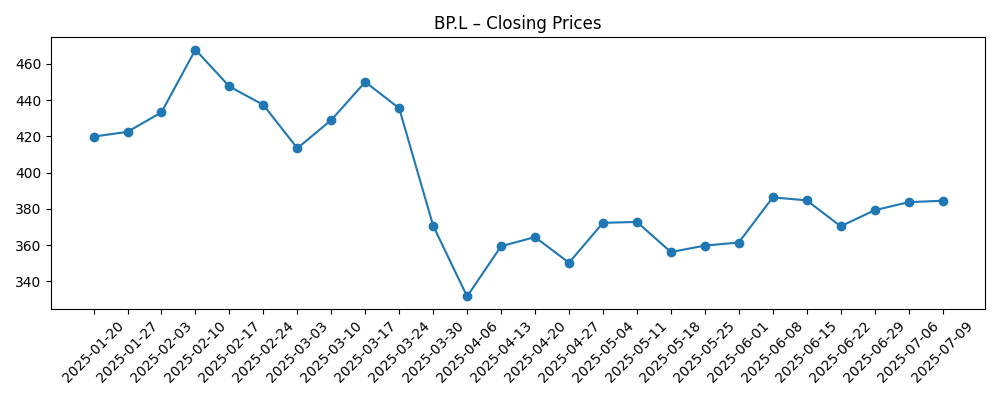
- Share price: latest weekly close 415.65; 52‑week range 329.20–472.25; 50‑day MA 406.98; 200‑day MA 399.15.
- Dividend: forward annual dividend rate 0.25; forward yield 5.74%; payout ratio 754.09%; last ex‑div 8/14/2025.
- Ownership & trading: float 14.97B; institutions hold 37.99%; 3‑month average volume 35.8M; beta (5Y) 0.42.
- Market cap & shares: large‑cap integrated energy company; shares outstanding 15.45B; implied shares outstanding 15.7B.
- Analyst view proxy: no rating data provided; 52‑week price change +5.23% vs S&P 500 +20.22%.
Share price evolution – last 12 months
Notable headlines
Opinion
BP’s share price action over the past six months underlines its exposure to the energy cycle, even with a low long‑term beta. After climbing to a February weekly close of 467.80, the stock fell sharply to a late‑March/early‑April trough near 370.70 and then to 331.70, before recovering into the 420s by late August and easing to 415.65 in early September. Absent company‑specific headlines in this window, those swings likely reflect shifting expectations for commodity prices, refining margins and macro growth. Technically, the shares sit modestly above both the 50‑day (406.98) and 200‑day (399.15) moving averages, suggesting near‑term stabilization. Over a three‑year horizon, we think fundamentals will dominate: maintaining operational reliability and capital discipline should matter more than short‑term price noise, while the 52‑week range of 329.20–472.25 provides a useful context for risk tolerance.
Income remains central to the equity story. The forward dividend yield of 5.74% (rate 0.25) is attractive, but the elevated payout ratio (754.09%) highlights the gap between reported earnings and cash distribution capacity. That gap is partly bridged by cash generation: operating cash flow is 23.29B and levered free cash flow 9.31B on a trailing basis, which supports the dividend if maintained. The tension for the next three years is straightforward: if cash flows remain resilient, the yield can anchor total return and dampen drawdowns; if the cycle weakens, management may need to rely on balance‑sheet flexibility or adjust the pace of distributions. With a current ratio of 1.21 and 35.31B in cash, liquidity is solid, but sustaining investor confidence will require consistent execution and clear capital‑allocation messaging.
Profitability metrics present a mixed picture. Reported profit margin is just 0.31% and return on equity 2.05%, which can suppress valuation multiples; however, operating margin at 9.13% and EBITDA of 27.35B indicate underlying operating heft not fully captured by net income. Over the next three years, incremental improvements in margin mix, cost control and asset optimization could lift returns even in a flat macro scenario. Quarterly revenue contraction (−1.30% yoy) argues for caution on top‑line momentum, but scale (revenue ttm 184.81B) and diversified operations provide buffers. Without company‑specific catalysts disclosed here, investors should treat macro drivers—global demand, supply discipline, and downstream margins—as the dominant variables, with the 50‑ and 200‑day moving averages serving as sentiment barometers rather than signals.
Leverage and ownership structure frame the risk‑reward. Debt of 74.98B versus cash of 35.31B and debt/equity at 93.99% leave little room for complacency if the cycle turns, yet also suggest ample operating leverage should the cycle firm. A float of 14.97B shares and average three‑month volume of 35.8M imply deep liquidity, helping the stock absorb shocks. Over three years, we see three broad paths: a constructive path where stable to improving cash flows support the dividend and gradual multiple repair; a base path where cash returns continue but re‑rating is limited; and a tougher path where weaker prices pressure coverage and sentiment. In all cases, discipline on spending and portfolio quality will be key to defending value while navigating the energy transition’s practical and regulatory demands.
What could happen in three years? (horizon September 2028)
| Scenario | Operations | Financials | Valuation/Share price |
|---|---|---|---|
| Best | Stable production and refining reliability; modest efficiency gains lift operating margin from the 9.13% baseline. | Cash generation broadly in line with recent ttm (OCF 23.29B; LFCF 9.31B); leverage trends down as debt is refinanced or reduced. | Yield remains intact; sentiment improves, allowing a re‑rating toward the upper end of recent trading context. |
| Base | Operational performance steady; mix improvements offset flat volumes; revenue growth stays muted. | Dividend funded largely from cash flow; balance sheet metrics (current ratio 1.21; D/E 93.99%) remain stable. | Total return driven mainly by dividend and modest multiple normalization around long‑term averages. |
| Worse | Macro softness and margin pressure; episodic outages or lower utilization weigh on earnings. | Cash flow tightens vs recent ttm; leverage creeps higher, forcing stricter capex prioritization and potential distribution recalibration. | De‑rating toward the lower end of the 52‑week context; volatility increases despite low historical beta. |
Projected scenarios are based on current trends and may vary based on market conditions.
Factors most likely to influence the share price
- Commodity prices and refining margins affecting revenue (184.81B ttm) and cash flow (OCF 23.29B).
- Capital allocation discipline versus dividend sustainability (forward yield 5.74%; payout ratio 754.09%).
- Balance‑sheet trajectory (total debt 74.98B; cash 35.31B; D/E 93.99%) and financing costs.
- Operational reliability and safety outcomes influencing margins (operating margin 9.13%) and sentiment.
- Policy and regulatory changes tied to the energy transition, affecting project economics and returns.
- Market risk appetite and relative performance (beta 0.42; 52‑week change +5.23% vs S&P 500 +20.22%).
Conclusion
BP enters the next three years with contrasting signals: scale and cash generation on one side; slim reported profitability and meaningful leverage on the other. The forward dividend yield of 5.74% provides a tangible anchor for returns, but its sustainability rests on preserving operating cash flow (23.29B ttm) and prioritizing spending within cash generation. Price action—swinging from a February weekly close near 467.80 to an April trough at 331.70 before stabilizing around 415.65—highlights sensitivity to macro drivers despite a low long‑term beta. Without fresh, company‑specific catalysts provided here, the base case is steady operations and measured capital discipline, with valuation outcomes dictated by the energy cycle and execution. For investors, the opportunity is a high‑yield, lower‑beta integrated energy name; the risk is that weaker prices or higher costs compress coverage and delay any re‑rating. Position sizing and time horizon remain essential.
This article is not investment advice. Investing in stocks carries risks and you should conduct your own research before making any financial decisions.