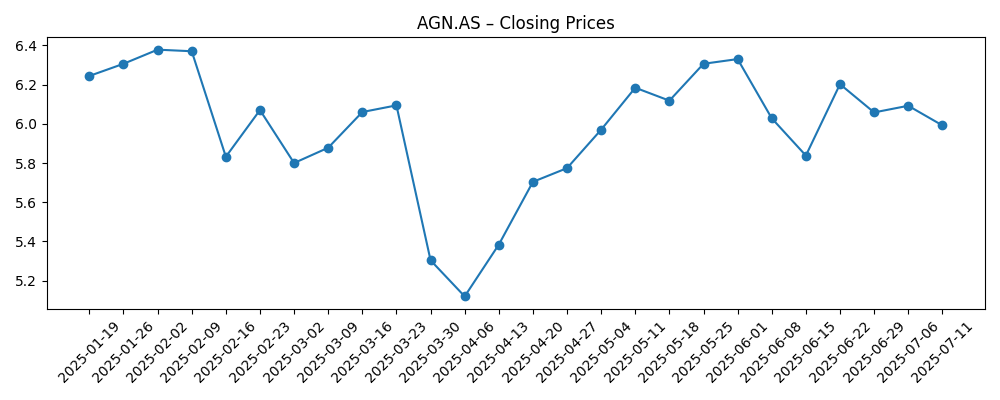
Aegon N.V. (AGN.AS) enters September 2025 with rising momentum and a larger buyback in place. The shares closed the last week of August at 6.72, within sight of the 52‑week high of 6.99, and up 21.63% over the past year. Fundamentals remain solid: trailing twelve‑month revenue of 13.07B, profit margin of 10.13% and return on equity of 14.96%. The stock trades at 8.62x trailing and forward earnings, 1.14x book, and offers a forward dividend of 0.38 (5.65% yield) ahead of a 9/3/2025 ex‑dividend date. With market cap at 10.58B and enterprise value at 11.65B, investors are weighing capital returns against execution and cash‑flow quality. This note outlines a three‑year outlook centered on the buyback, the dividend, and the durability of earnings.
Key Points as of August 2025
- Revenue: TTM revenue 13.07B; quarterly revenue growth (yoy) 3.5%; revenue per share 8.20.
- Profit/Margins: Profit margin 10.13%; operating margin 10.91%; return on equity 14.96%.
- Cash flow & balance sheet: Operating cash flow (ttm) -61M; levered free cash flow 2.42B; total cash 3.2B; total debt 4.27B; total debt/equity 45.46%.
- Share price: Last weekly close 6.72 (Aug 29, 2025); 52‑week range 4.79–6.99; 50‑day MA 6.25; 200‑day MA 6.04; beta 0.89.
- Capital returns: Forward dividend rate 0.38 (5.65% yield); payout ratio 44.87%; ex‑dividend date 9/3/2025; buyback program increased (see headline).
- Valuation: P/E (ttm and forward) 8.62; price/book 1.14; price/sales 0.77; EV/Revenue 0.68.
- Market cap & EV: Market cap 10.58B; enterprise value 11.65B; shares outstanding 1.57B; float 1.2B.
- Ownership & liquidity: Insiders hold 17.21%; institutions 34.02%; average 3‑month volume 5.07M; 10‑day average 5.0M.
- Sales/backlog: No formal backlog; recurring insurance and investment income underpin sales; gross profit (ttm) 6.05B.
Share price evolution – last 12 months

Notable headlines
Opinion
Aegon’s decision to increase its share buyback arrives as the stock trades near the top of its 52‑week range, reinforcing management’s view that the balance sheet and earnings stream can support simultaneous repurchases and an attractive dividend. At 8.62x earnings and 1.14x book, buybacks are likely accretive to per‑share metrics if executed consistently. The yield of 5.65% and a payout ratio of 44.87% suggest capacity to maintain distributions while still funding repurchases. The key watchpoint is cash‑flow quality: levered free cash flow of 2.42B contrasts with a modestly negative operating cash flow (ttm) of -61M, a reminder that timing effects and market moves can swing reported figures in financials. The elevated focus over the next year will be on the cadence of buyback execution versus earnings visibility.
Price action has been constructive. The shares recovered from spring weakness (with a weekly close around 5.30 on Mar 30, 2025) to 6.72 by Aug 29, staying above both the 50‑day (6.25) and 200‑day (6.04) moving averages. A 21.63% 52‑week gain alongside a beta of 0.89 points to resilient, lower‑volatility participation in the broader market rally. If Aegon sustains mid‑single‑digit top‑line growth and double‑digit operating margins, the current multiple leaves room for a moderate re‑rating, particularly if cash generation tracks reported earnings more closely. Conversely, proximity to the 52‑week high (6.99) means expectations are elevated; any stumble in execution, regulatory surprises, or market drawdowns could push the shares back into the mid‑range of the past year.
On fundamentals, the mix of a 10.13% profit margin, 10.91% operating margin, and 14.96% ROE is consistent with a steady, capital‑disciplined insurer. Debt of 4.27B against 3.2B cash and a 45.46% debt/equity ratio looks manageable. The long‑term case depends on sustaining revenue growth (3.5% yoy in the most recent reading) and defending margins as rates and credit spreads evolve. With price/book at 1.14 and EV/Revenue at 0.68, valuation still signals caution about growth durability; consistent delivery could narrow that discount to higher‑growth financials. Execution on cost control and product mix, coupled with stable markets, would help translate accounting earnings into stronger recurring cash flow.
The dividend anchors total return. A forward rate of 0.38 (5.65% yield) and an upcoming ex‑dividend date of 9/3/2025 provide a near‑term catalyst for income‑focused holders. Ownership is balanced—17.21% insiders and 34.02% institutions—with a sizeable 1.2B float and average 3‑month volume of 5.07M, supporting buyback activity without undue liquidity stress. Over three years, the optimal outcome combines steady earnings, a maintained payout policy, and consistent buybacks to reduce share count, which can offset modest revenue growth. The bear case centers on earnings volatility translating into lower distributable cash, forcing a slower buyback pace or a dividend reset. With the share price near its high, the risk/reward skews to disciplined monitoring of capital returns and cash generation.
What could happen in three years? (horizon August 2025+3)
| Scenario | What it looks like by August 2028 |
|---|---|
| Best | Buybacks proceed steadily and earnings remain resilient, supporting the dividend. Market confidence improves, valuation edges higher versus book, and the shares outperform on a total‑return basis with lower‑than‑market volatility. |
| Base | Revenue growth stays modest and margins hold near current levels. Dividend is maintained, buybacks are opportunistic, and the stock largely tracks earnings and yield, oscillating within a broad trading band around recent averages. |
| Worse | Macro or market shocks pressure investment income and claims, crimping cash flow. Management slows buybacks and reassesses the payout. Valuation compresses toward more cautious levels, and shares trade closer to the lower end of the past year’s range. |
Projected scenarios are based on current trends and may vary based on market conditions.
Factors most likely to influence the share price
- Execution and pacing of the increased share buyback program, including timing versus market liquidity.
- Interest‑rate path and credit spreads in core markets affecting investment income and asset valuations.
- Earnings and cash‑flow consistency (levered free cash flow versus operating cash flow) and visibility of underlying drivers.
- Regulatory or capital‑framework changes that influence dividend capacity and balance‑sheet flexibility.
- Dividend policy developments (payout ratio, reinvestment needs) and the impact of the 9/3/2025 ex‑dividend date on near‑term flows.
- Macro shocks and market volatility that could shift risk appetite for European financials.
Conclusion
Aegon’s refreshed capital‑return stance—adding to buybacks while maintaining a 5.65% forward yield—underscores confidence in the earnings base and balance‑sheet flexibility. At 8.62x earnings and 1.14x book, the valuation suggests the market expects steady rather than rapid growth, leaving scope for a measured re‑rating if revenue (13.07B ttm) and margins are sustained and cash generation aligns with reported profits. The 21.63% 52‑week gain and a price near the 6.99 high raise the execution bar, especially with negative operating cash flow (ttm) offset by robust levered free cash flow. Our base case envisions range‑bound trading anchored by income and opportunistic buybacks; the bull case sees compounding from per‑share improvements; the bear case hinges on macro or regulatory shocks forcing a slower return of capital. Near term, the 9/3/2025 ex‑dividend date and buyback cadence are key signposts for investor sentiment.
This article is not investment advice. Investing in stocks carries risks and you should conduct your own research before making any financial decisions.


