


PDD Holdings Inc., the Chinese e-commerce group behind value-driven marketplaces, enters October 2025 with strong profitability, ample cash, and a share price that has recovered from spring weakness. Over the last six months, the ADR rebounded from April lows toward the upper end of its recent range, while trailing revenue of 409.62B and a profit margin of 23.91% underscore operating resilience. Growth has moderated, with quarterly revenue up 7.10% year over year and quarterly earnings down 3.90%, but operating efficiency remains high and leverage is minimal. With 387.13B of cash against 10.96B of debt and robust free cash flow, PDD has room to keep investing, defend share, and navigate pricing actions. Recent coverage skews constructive, and short interest is modest, setting the stage for a three‑year outlook focused on execution, regulation, and competitive intensity.
Key Points as of October 2025
- Revenue: TTM revenue of 409.62B; quarterly revenue growth at 7.10% year over year.
- Profit/Margins: Profit margin 23.91%; operating margin 24.80%; gross profit 235.31B; EBITDA 92.43B; net income 97.92B; diluted EPS 9.32.
- Cash & Balance Sheet: Total cash 387.13B vs. total debt 10.96B; current ratio 2.36; total debt/equity 3.03%.
- Cash Flow & Efficiency: Operating cash flow 94.23B; levered free cash flow 79.22B; revenue per share 294.47; book value per share 259.04.
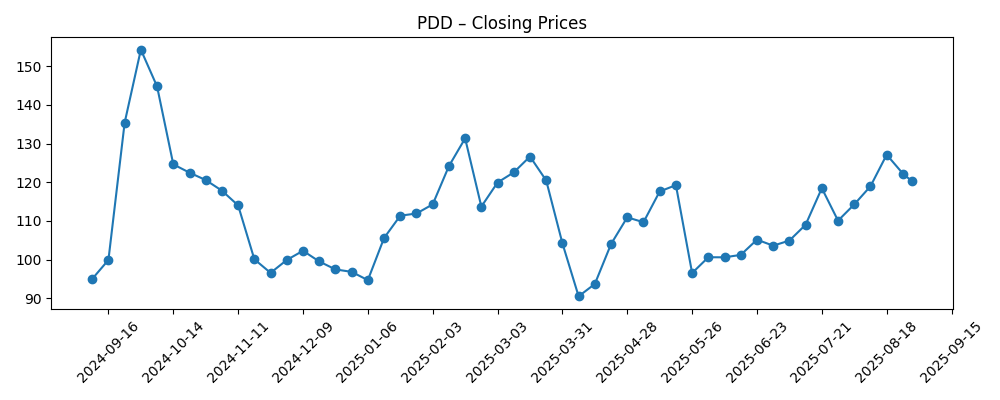
- Share price: Rebounded from 90.50 (2025-04-07 weekly close) to 132.17 (2025-09-30); 50-day MA 121.49 and 200-day MA 111.70; 52-week high 155.67 and low 87.11; 52-week change –10.28% vs S&P 500 at 16.68%.
- Analyst view & Sentiment: Recent coverage trends bullish; short interest 23.98M, short ratio 2.29, and short % of float 2.81% indicate limited bearish pressure.
- Ownership & Liquidity: Institutions hold 31.80%; insiders 0.00%; average 3‑month volume 8.2M (10‑day average 10.62M); float 3.05B.
- Market cap: Not disclosed in this snapshot; valuation context supported by earnings power and cash reserves.
Share price evolution – last 12 months
Notable headlines
- Where is PDD Holdings (PDD) Headed According to Analyst?
- Wall Street is Bullish on PDD Holdings (PDD), Here’s Why?
- 58,099 Shares in PDD Holdings Inc. Sponsored ADR $PDD Acquired by Strs Ohio
- Advisors Asset Management Inc. Has $625,000 Stake in PDD Holdings Inc. Sponsored ADR $PDD
- NewEdge Advisors LLC Raises Stock Holdings in PDD Holdings Inc. Sponsored ADR $PDD
- PDD Holdings Inc. Sponsored ADR $PDD Shares Purchased by Farther Finance Advisors LLC
Opinion
Shares of PDD staged a notable recovery through late summer after a steep spring drawdown, with the ADR climbing from April’s weekly close near 90.50 to 132.17 by the end of September. The price now sits above the 50‑day moving average of 121.49 and the 200‑day at 111.70, signaling improving momentum even as the 52‑week change remains negative at –10.28% versus a 16.68% gain for the S&P 500. A five‑year beta of 0.45 suggests lower systematic volatility than many peers, which can help cushion broader market swings but does not eliminate idiosyncratic risk. In our view, the rebound reflects confidence that recent revenue growth of 7.10% year over year, while slower than prior periods, is still supported by resilient engagement and promotional intensity. The key question over the next three years is whether growth can re‑accelerate without eroding the company’s margin profile.
Operationally, PDD enters this period from a position of strength. Trailing‑twelve‑month revenue stands at 409.62B, underpinned by gross profit of 235.31B and EBITDA of 92.43B. Profitability metrics remain robust, with a profit margin of 23.91% and operating margin of 24.80%, translating into net income of 97.92B and diluted EPS of 9.32. The balance sheet is a competitive advantage: total cash of 387.13B dwarfs total debt of 10.96B, the current ratio is 2.36, and total debt to equity is 3.03%. Cash generation is healthy, with operating cash flow of 94.23B and levered free cash flow of 79.22B, giving management ample flexibility to fund customer acquisition, logistics efficiency, and technology enhancements. Over a three‑year horizon, that cash optionality can be decisive in sustaining share gains while absorbing periods of promotional pressure, even if quarterly earnings growth, currently –3.90% year over year, remains uneven.
Investor positioning looks balanced but supportive. Short interest was 23.98M shares as of mid‑September, with a short ratio of 2.29 and only 2.81% of float sold short, indicating limited outright bearish conviction. Institutions hold 31.80% of shares while insiders are reported at 0.00%, and average trading volume of 8.2M over three months (10.62M over ten days) provides liquidity. Recent analyst commentary has tilted positive, as reflected in coverage arguing that Wall Street is bullish and debating where the stock heads next. That stance seems grounded in the company’s margin resilience and cash position. Still, with revenue per share at 294.47 and book value per share at 259.04, the market will likely demand continued execution on engagement and monetization. Any signals that growth is re‑accelerating without heavy subsidy should support multiple stability; signs of escalating competition or regulatory friction could cap upside.
Over the next three years, we think the core debate crystallizes around growth quality versus growth quantity. If PDD can compound its user base while deepening merchant relationships and improving logistics efficiency, it could sustain operating margins near current levels while leaning on its 387.13B cash buffer to out‑invest rivals when needed. Conversely, if competitive intensity forces structurally higher subsidy rates or marketing spend, quarterly earnings pressure like the current –3.90% year‑over‑year trend could persist, even if top‑line growth remains positive. International expansion and cross‑border initiatives may add volatility but also create optionality, particularly if local partnerships reduce customer acquisition costs. Given the ADR’s improving technical backdrop above the 50‑ and 200‑day moving averages, the setup appears constructive into 2026; however, headline sensitivity around policy or platform governance will remain a swing factor, and investors should expect periods of elevated dispersion.
What could happen in three years? (horizon October 2025+3)
| Scenario | Narrative (to October 2028) | Implied stock setup |
|---|---|---|
| Best | Growth re‑accelerates above the recent 7.10% pace as user engagement improves and logistics efficiency compounds. Operating margin remains near today’s level, supported by disciplined promotions. Strong cash generation funds technology and ecosystem investments without diluting profitability. | Sentiment turns broadly constructive; shares sustain an uptrend supported by earnings compounding and rising confidence in durability. |
| Base | Revenue growth tracks around recent trends with periodic variability, while margins are stable to slightly lower amid normalizing promotions. Cash remains a strategic buffer, enabling steady investment and selective expansion. | Stock largely follows earnings and cash flow cadence, with range‑bound periods punctuated by headline‑driven moves. |
| Worse | Regulatory friction or intense competition forces heavier subsidies and elevated marketing, compressing margins. Growth slows and confidence in monetization weakens, despite continued investment needs. | Multiple contracts and volatility rises; shares underperform until clearer evidence of margin recovery or policy relief emerges. |
Projected scenarios are based on current trends and may vary based on market conditions.
Factors most likely to influence the share price
- Regulatory actions and platform governance requirements in core and cross‑border markets.
- Competitive intensity in promotions, merchant incentives, and logistics efficiency.
- Consumer demand and macro conditions affecting discretionary spending and advertising.
- Capital allocation signals (investment pace, potential buybacks/dividends, and cash deployment discipline).
- ADR, audit, and geopolitical headlines that affect investor access, sentiment, or risk premia.
Conclusion
PDD’s three‑year setup balances strong fundamentals against execution and policy risks. The company enters this period with substantial financial firepower: 387.13B in cash versus 10.96B in debt, healthy operating cash flow, and double‑digit operating margins that have proven resilient. While top‑line growth has moderated to 7.10% year over year and quarterly earnings dipped 3.90%, the cash and margin profile provide room to keep investing in user experience, merchant tools, and logistics without sacrificing strategic flexibility. After rebounding from April’s lows, the ADR trades above its 50‑ and 200‑day averages, suggesting improving momentum even as the 52‑week change remains negative. Recent analyst commentary is constructive and short interest is modest, but the market will look for sustained growth without higher subsidy intensity. In our view, disciplined spending and steady engagement are the swing variables that determine whether the next three years deliver compounding or merely stability.
This article is not investment advice. Investing in stocks carries risks and you should conduct your own research before making any financial decisions.


