Hyundai Motor’s near-term setup is a tug‑of‑war: revenue is expanding (+7.3% year over year) while quarterly earnings contracted, squeezing margins and clouding cash generation. The stock has drifted lower over the past year (-10.57%), even as operations held up, reflecting investor concern over EV price competition, currency swings and elevated investment needs. The latest print shows a healthier top line alongside pressure on profitability and working capital, a common pattern as the global auto cycle normalizes after supply bottlenecks. For investors, the debate is whether margin compression is transient—driven by incentives, product mix and ramp costs—or structural amid intensifying competition. Policy and trade dynamics add uncertainty but also potential tailwinds in select markets. With a still‑committed dividend and comparatively low beta, Hyundai offers some defensiveness; however, the path of cash conversion, balance sheet flexibility and pricing discipline will likely dictate the multiple from here. This three‑year outlook weighs those moving parts and frames the scenarios that could shape returns over the next three years.
Key Points as of October 2025
- Revenue: TTM revenue of 182.25T with quarterly revenue growth of 7.30% year over year.
- Profit/Margins: Profit margin 6.30%; operating margin 7.46%; quarterly earnings growth -24.50% year over year indicates pressure on profitability.
- Sales/Backlog: Backlog not disclosed; growth suggests resilient demand, but incentives and mix likely weighed on earnings.
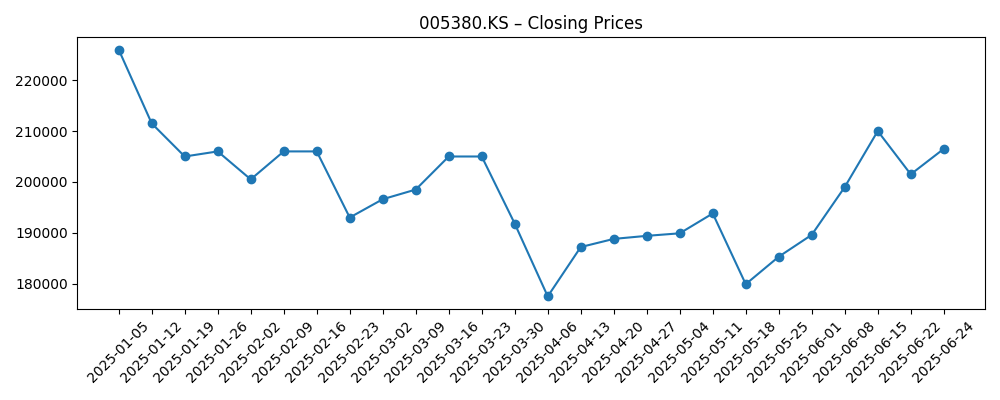
- Share price: Traded roughly 177,500–223,500 over the last six months; last close 218,500 (Oct 10); 52‑week change -10.57%.
- Analyst view: Not disclosed in the supplied data; beta of 0.80 implies lower volatility than the broader market.
- Market cap: Approximately KRW 44T (price 218,500 × 202.01M shares outstanding).
- Balance sheet: Total cash 26.5T; total debt 155.37T; current ratio 0.77; debt/equity 127.84%.
- Cash flow: Operating cash flow -5.93T (TTM) vs. levered free cash flow +954.46B—mixed cash signals during investment and working‑capital normalization.
- Dividend: Forward dividend 10,000 (yield 4.55%); payout ratio 23.96%; last ex‑dividend 8/28/2025.
Share price evolution – last 12 months
Notable headlines
Opinion
Top‑line growth and lower earnings can coexist when incentives, product mix, or launch costs dilute margins—and Hyundai’s latest cadence fits that mold. Revenue growth of 7.30% year over year signals healthy volume and pricing resilience, but the -24.50% earnings growth points to pressure beneath the surface. A 6.30% profit margin and 7.46% operating margin are respectable for a mass‑market automaker, yet they likely reflect higher EV and hybrid ramp costs, selective discounting to defend share, and currency effects. The share price’s modest recovery from spring lows suggests investors are willing to underwrite stabilization but want clearer proof that margin compression is transient rather than structural. In short, the quality of growth—how much falls to the bottom line—matters more than absolute unit expansion in this phase.
Cash generation and balance‑sheet flexibility are the swing factors. TTM operating cash flow is negative (-5.93T), while levered free cash flow is positive (+954.46B), a combination consistent with working‑capital swings, elevated capex, and disciplined financing. With 26.5T in cash against 155.37T in debt and a current ratio of 0.77, liquidity needs active management; auto groups often carry large financing books, which can skew headline leverage. The forward dividend of 10,000 (4.55% yield) and a 23.96% payout ratio underline commitment to returns, but sustaining this hinges on converting revenue into cash as the product mix shifts. The equity story improves materially if inventory normalizes and incentive intensity eases, releasing cash back into the system.
Industry conditions are a mixed bag. EV and hybrid demand is growing but uneven across regions, and price competition has intensified as new entrants pressure incumbents. Policy uncertainty—tariffs, local‑content rules, and shifting subsidies—cuts both ways, creating headwinds in some markets and openings in others. Supply chains for chips and batteries are steadier than during the pandemic era, yet input‑cost and logistics volatility persists. Against this backdrop, a diversified powertrain mix can be a buffer, but it also complicates manufacturing complexity and margin management. The companies that hold pricing and trim incentives without sacrificing share will defend returns best.
For valuation, the narrative may pivot from “growth at any cost” to “profitable growth with cash conversion.” A relatively low beta (0.80) and a consistent dividend can anchor downside, but multiple expansion likely requires evidence of sustained margin stabilization and cleaner cash flow. If Hyundai demonstrates pricing discipline, improves mix in higher‑margin vehicles, and keeps investment focused on platforms with clear payback, the market could reward it with a sturdier earnings multiple. Conversely, prolonged EV price wars, warranty or recall costs, or a weaker consumer would keep the stock range‑bound as investors discount lower through‑cycle profitability. Clarity on the capital allocation framework and investment cadence will shape the narrative over the next three years.
What could happen in three years? (horizon October 2025+3)
| Scenario | Narrative |
|---|---|
| Best | Pricing holds as incentives normalize; mix shifts toward higher‑margin models; EV/hybrid ramps proceed with supply stability; cash conversion improves and leverage declines; the dividend remains well‑covered, supporting a sturdier valuation narrative. |
| Base | Revenue grows modestly; competition keeps margins broadly flat; capex stays elevated but predictable; working‑capital swings moderate, allowing gradual cash improvement; dividend continuity maintained with a disciplined payout. |
| Worse | Global demand softens and EV price wars intensify; persistent incentive use erodes margins and cash flow; currency and regulatory headwinds add volatility; leverage limits flexibility and dividend parameters are revisited. |
Projected scenarios are based on current trends and may vary based on market conditions.
Factors most likely to influence the share price
- Execution on EV/hybrid launches and software quality, including warranty outcomes and recall exposure.
- Pricing discipline and incentive intensity across key markets amid ongoing EV and ICE competition.
- Battery, semiconductor and logistics costs, and the stability of the supply chain.
- Currency moves (KRW vs. USD/EUR) and trade policy, including tariffs and local‑content rules.
- Capital allocation balance between capex, working capital, and dividends as cash conversion evolves.
Conclusion
Hyundai Motor enters the next phase with a solid revenue base but a profitability and cash‑flow debate. Growth of 7.30% year over year on the top line contrasts with a -24.50% earnings print, highlighting the cost of defending share and funding the transition to electrified line‑ups. The balance sheet can support this, albeit with careful liquidity management given a 0.77 current ratio and substantial gross debt. A forward dividend with a sub‑25% payout offers a cushion, yet durability depends on converting sales into cash as incentives normalize and mix improves. Sector‑wide, EV adoption is uneven and price competition remains intense, but supply chains are more predictable, which should help execution. Watch next 1–2 quarters: backlog visibility and order intake; gross-to-operating margin bridge (incentives, mix, FX); working‑capital unwinds and inventory; cadence of capex and software spend; dividend coverage by free cash flow. The three‑year path is likely shaped less by unit growth and more by pricing power and cash discipline.
This article is not investment advice. Investing in stocks carries risks and you should conduct your own research before making any financial decisions.